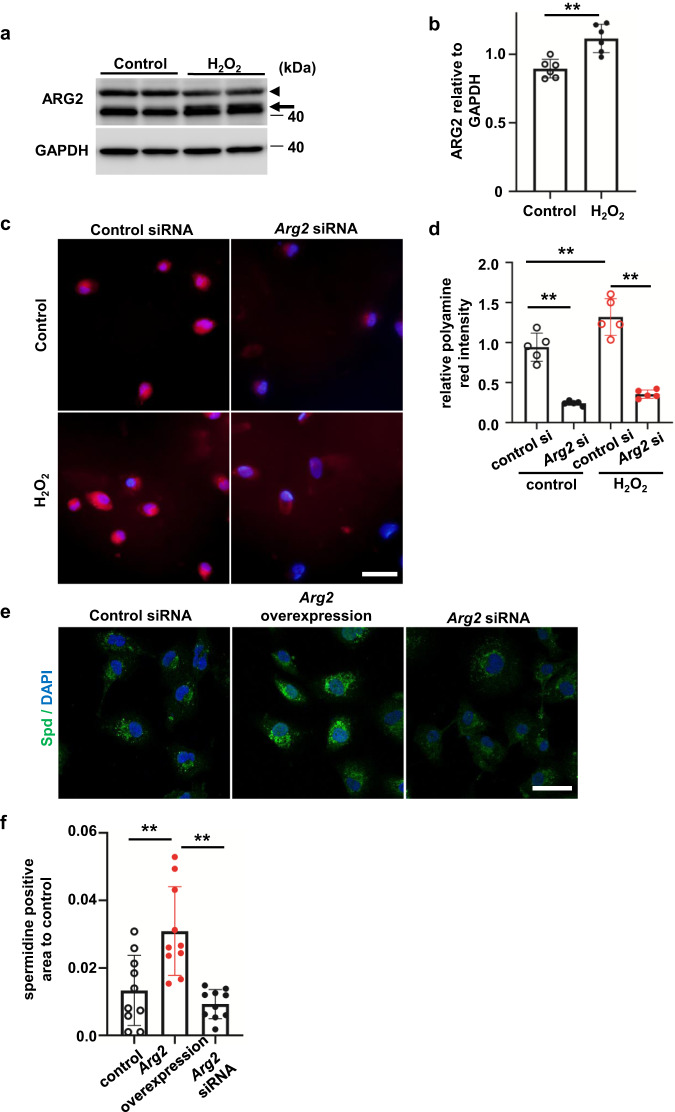
Fig. 3. Oxidative stress upregulates ARG2 protein levels in renal tubular epithelial cells.
a Western blot analysis of ARG2 protein levels in HK-2 cells stimulated with H2O2. The arrowhead shows a nonspecific signal. b Relative levels of ARG2 protein normalized to GAPDH are shown (n = 6 in each group). Data are indicated as means ± SD. c Polyamine red staining in control or Arg2 siRNA-transfected HK-2 cells stimulated with H2O2. Red, polyamine; blue, DAPI. Scale bars, 20 µm. d Quantification of polyamine red fluorescence intensity/cell shown in Fig. 3c (n = 5 in each group). Data are indicated as means ± SD. e Immunofluorescence images of Spd in HK-2 cells with Arg2 overexpression or knockdown. Green, anti-Spd antibody; blue, DAPI. Scale bars, 20 µm. f Quantification of the Spd-positive area corrected for nuclei (n = 10 in each group). Data are indicated as means ± SD. *P < 0.05, **P < 0.01. Spd spermidine, ARG2 arginase 2, DAPI 4′,6-diamidino-2-phenylindole, GAPDH glyceraldehyde-3-phosphate dehydrogenase.

