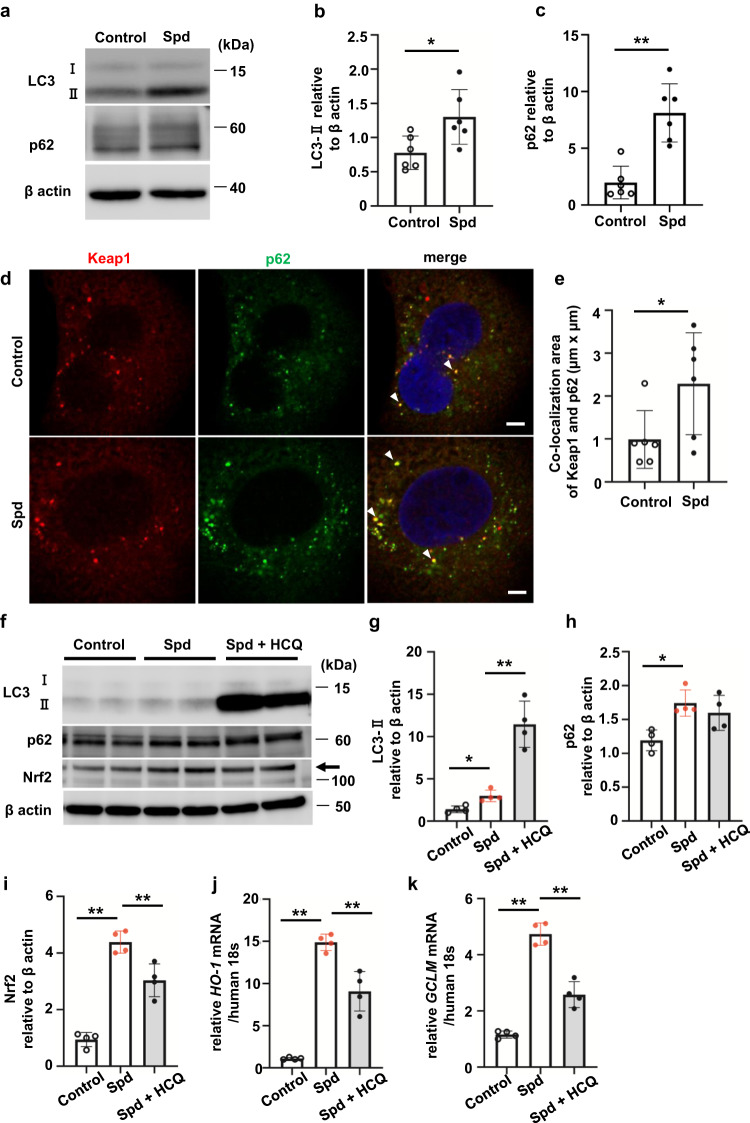
Fig. 5. Spd activates autophagy, resulting in acceleration of Keap1 degradation in renal tubular epithelial cells.
a Western blot analysis of LC3-I and II and p62 in HK-2 cells incubated with Spd. b Relative levels of LC3-II protein normalized to β-actin are shown (n = 6 in each group). Data are indicated as means ± SD. c Relative levels of p62 protein normalized to β-actin are shown (n = 6 in each group). Data are indicated as means ± SD. d Confocal immunofluorescence microscopic images of Keap1 and p62 in HK-2 cells incubated with Spd. Red, anti-Keap1 antibody; green, anti-p62 antibody; blue, DAPI. White arrowheads indicate co-localized areas. Scale bars, 5 µm. e Quantification of co-localization areas of Keap1 and p62 in each cell. Data are indicated as means ± SD. f Western blot analysis of LC3-I and II, p62, and Nrf2 in HK-2 cells incubated with Spd in the presence of HCQ. g LC3-II, h p62, and i Nrf2 relative protein levels normalized to β-actin are shown (n = 4 in each group). Data are indicated as means ± SD. j HO-1 and k GCLM mRNA expression determined by real-time PCR (n = 4 in each group). Data are indicated as means ± SD. *P < 0.05, **P < 0.01. Spd spermidine, LC3 microtubule-associated protein 1A/1B-light chain 3, Keap1 kelch-like ECH-associated protein 1, HCQ hydroxychloroquine.

