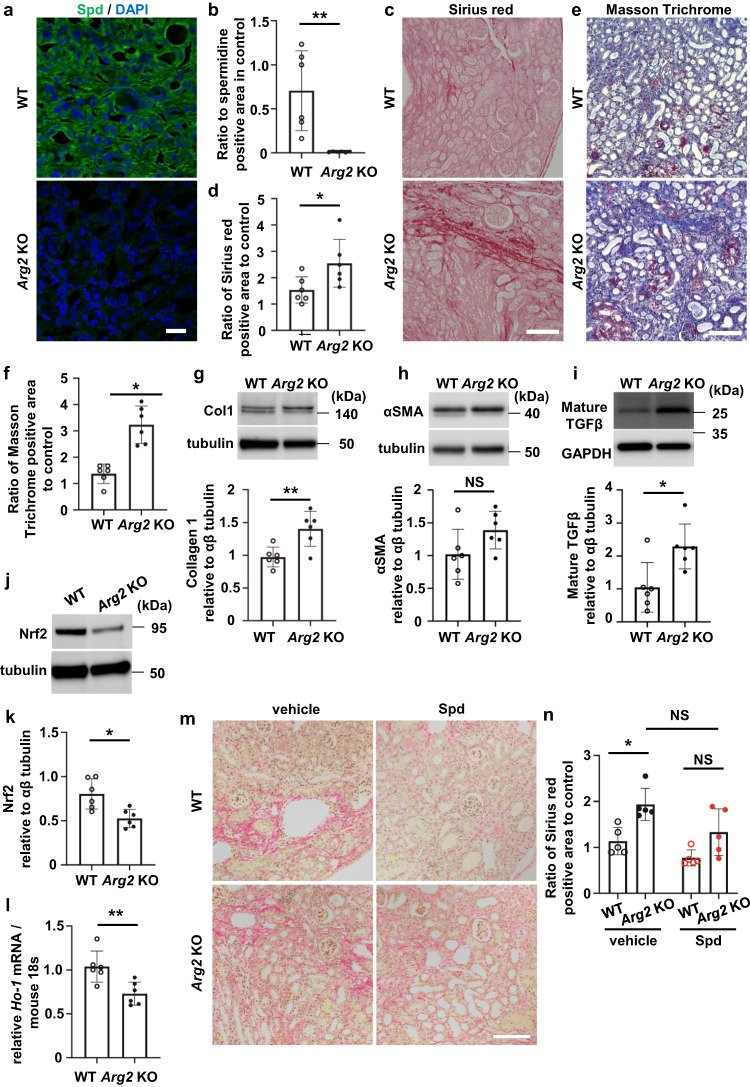
Fig. 7. UUO-induced kidney fibrosis is aggravated in the Arg2 knockout mouse kidney.
a Confocal immunofluorescence images of Spd in the UUO kidney of WT and Arg2 KO mice. Green, anti-Spd antibody; blue, DAPI. Scale bars, 20 µm. b Quantification of the Spd-positive area (n = 6 in each group). Data are indicated as means ± SD. c Representative images of Sirius red staining in the UUO kidney of WT and Arg2 KO mice. Scale bars, 100 µm. d Quantification of the Sirius red staining-positive area (n = 6 in each group). Data are indicated as means ± SD. e Representative images of Masson trichrome staining in the UUO kidney of WT and Arg2 KO mice. Scale bars, 100 µm. f Quantification of the Masson trichrome staining-positive area (n = 6 in each group). Data are indicated as means ± SD. g Western blot analysis of collagen type 1 protein in the UUO kidney of WT and Arg2 KO mice. Quantification of relative levels of collagen type 1 protein normalized to αβ tubulin are shown on the right (n = 6 in each group). Data are indicated as means ± SD. h Western blot analysis of αSMA protein in the UUO kidney of WT and Arg2 KO mice. Quantification of relative levels of αSMA protein normalized to αβ tubulin are shown on the right (n = 6 in each group). Data are indicated as means ± SD. i Western blot analysis of mature TGFβ protein in the UUO kidney of WT and Arg2 KO mice. Quantification of relative levels of mature TGFβ protein normalized to αβ tubulin are shown on the right (n = 6 in each group). Data are indicated as means ± SD. j Western blot analysis of Nrf2 protein in the UUO kidney of WT and Arg2 KO mice. k Quantification of relative levels of Nrf2 protein normalized to αβ tubulin (n = 6 in each group). Data are indicated as means ± SD. l HO-1 mRNA expression in the UUO kidney of WT and Arg2 KO mice determined by real-time PCR (n = 6 in each group). Data are indicated as means ± SD. m Representative images of Sirius red staining in the UUO kidney of WT and Arg2 KO mice treated with Spd. Scale, 100 µm. n Quantification of the Sirius red staining-positive area (n = 5 in each group). Data are indicated as means ± SD. *P < 0.05, **P < 0.01. NS not significant, UUO unilateral ureteral obstruction, Col1 collagen 1, Spd spermidine, DAPI 4′,6-diamidino-2-phenylindole, αSMA α smooth muscle actin, TGFβ transforming growth factor β1, Nrf2 nuclear factor erythroid 2-related factor 2.

