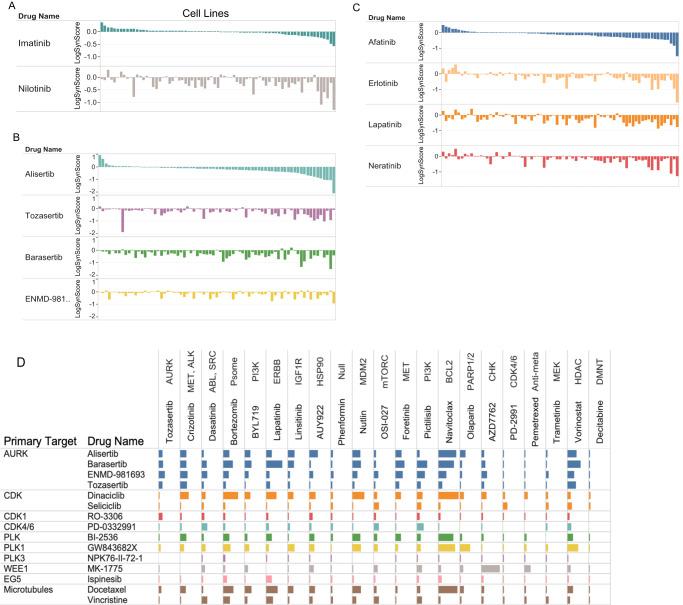
Fig. 4. Differential synergistic outcome for mechanistically related drugs.
A–C The pattern of synergies for a given drug is presented as a ranked ordered plot of synergy scores for the first listed drug (top) compared to the synergy score of related drugs with cell lines in the same order as for the first drug. The log of the synergy score is plotted. A Anchor drug is trametinib (MEK1/2) B Anchor drug is vorinostat (HDAC); C Anchor drug is OSI-027 (MTORC1/2). D Overview of differential pattern for related library drugs across anchors. Selected library drugs with similar targets were chosen (rows) and the number of synergies in combination with the indicated anchors (columns) are plotted as bars (the bar size is proportional to percent of the synergy scores that are within the top 5% of all synergy scores).

