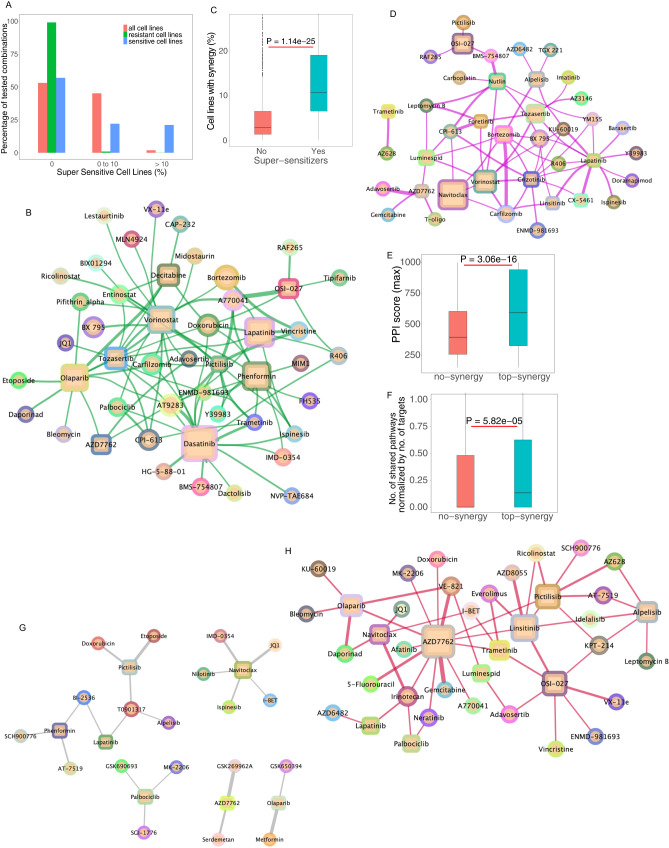
Fig. 7. Relationship between sensitivity to single agents and combinatorial outcome.
A Combinations rarely affect viability beyond effects observable with single agents. The effect of combination treatment on each cell line was compared to the overall sensitivity to single agents observed across all cell lines. The percentile of cell lines in which the combination effect is superior to the effect of single agents in any cell lines (super sensitive cell lines) is shown in three categories (0, no observable supersensitive lines, 0–10% and over 10%). The cell lines are further broken down based on their response to single agents (color). B Network view of drug combinations resulting in super-sensitization. Anchors are displayed as squares and library drugs as circles. Library drugs that are also used as anchor drugs are represented by squares. C Supersensitive events are enriched in synergies. The percentile of synergistic events (cell lines) are compared between combinations that yield super sensitization versus (n = 92) those that do not (n = 4990). One-sided Wilcoxon rank-sum test p value is shown. D Synthetic lethal drug pairs: Network of drug combinations for drugs that yield substantial viability effect while single agents are deemed inactive. E Drugs with targets that are in close interaction with each other based on previously determined protein–protein interaction network are more likely to yield synergies than those targeting un-connected proteins (n = 157 ‘top-synergy’, n = 58 '‘no-synergy”). One-sided Wilcoxon rank-sum test p value is shown. F Drugs that target members of a given biological pathway are more likely to yield synergy than those that target members of different pathways (n = 635 ‘top-synergy’, n = 784 '‘no-synergy'’). One-sided Wilcoxon rank-sum test p value is shown. The box plots for figures (C), (E), (F) have median center, 25 and 75 percentiles (Q1 and Q3) as bounds of the box, the minima and maxima being Q1 – 1.5 x IQR and Q3 + 1.5 x IQR (with IQR being interquartile range). G Synergistic drug pairs for which targets are encoded by genes engaged in a synthetic lethal interaction based on TCGA data analysis. H Synergistic drug pairs with experimental evidence for a synthetic lethal relationship.

