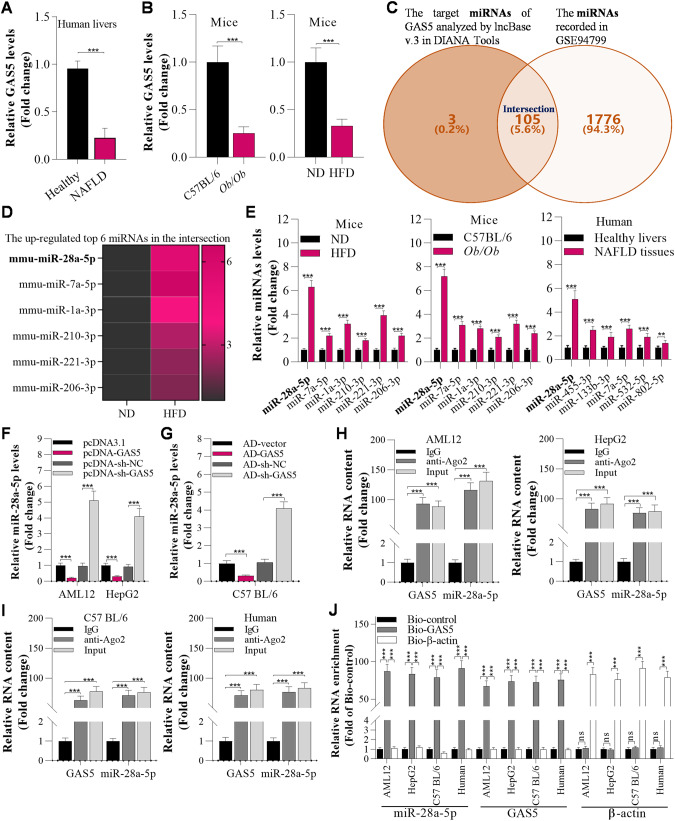
Fig. 1. GAS5 interacts with miR-28a-5p in hepatic cell lines and the livers of mice.
A RT‒qPCR analysis of lncRNA GAS5 expression in the liver in healthy humans and humans with NAFLD (n = 16/group). B RT‒qPCR analysis of GAS5 expression in the livers of mice fed a ND or HFD at the12th week (n = 8/group). C The Venn diagram was generated by taking the intersection of the target miRNAs of GAS5 (catalogued in lncBase v.3 in DIANA Tools) and the miRNAs in GSE94799. D Heatmap showing the top 6 upregulated overlapping miRNAs in the livers of HFD-fed mice. E RT‒qPCR analysis of the top 6 miRNAs in the livers of healthy humans and humans with NAFLD (n = 16/group) and in the livers of ND-fed and HFD-fed mice at the 12th week (n = 8/group); #p < 0.05 versus healthy livers or ND-fed mice. F RT‒qPCR analysis of miR-28a-5p levels in AML12 and HepG2 cells 12 h after transfection with pcDNA3.1, pcDNA-GAS5, pcDNA-sh-NC, and pcDNA-sh-GAS5. G RT‒qPCR analysis of miR-28a-5p levels in the livers of mice 7 days after transfection with AD-vector, AD-GAS5 AD-sh-NC, or AD-sh-GAS5. H RT‒qPCR analysis of GAS5 and miR-28a-5p levels in AML12 and HepG2 cell lysates incubated with an anti-Ago2 antibody for RIP. I RT‒qPCR analysis of GAS5 and miR-28a-5p levels in C57BL/6 mouse or human tissue lysates incubated with an anti-Ago2 antibody for RIP assay. J RT‒qPCR analysis of GAS5 and miR-28a-5p enrichment using a biotinylated GAS5 pull-down assay in AML12 cells, HepG2 cells, mouse livers and human livers. The data are presented as the mean ± S.D. of three independent experiments. Two-tailed Student’s t test was used to determine the significance of differences between two groups (A, B, E, F, G), and ANOVA with the Bonferroni post hoc test was conducted for comparisons among more than two groups (H, I, J). A p value of <0.05 was considered statistically significant; and *p < 0.05, **p < 0.01, ***p < 0.001; nsp > 0.05, ns not significant.

