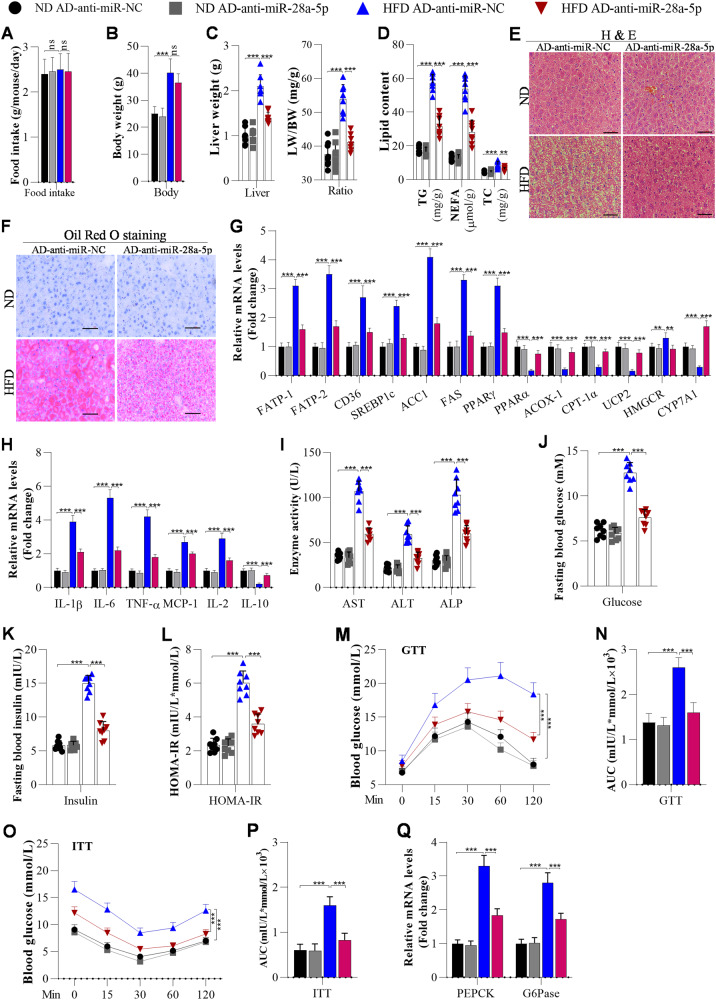
Fig. 2. Knockdown of miR-28a-5p attenuates HFD-induced hepatic steatosis, inflammation, and insulin resistance in HFD-fed mice.
Mice were fed a ND or HFD for 12 weeks. Then, they were injected with adenoviruses every 10 days, and these mice were continuously fed a ND or HFD. After the first injection for 3 weeks, the mice were used for further analysis. A Food intake was measured every day during ND or HFD feeding (n = 8/group). B The body weight of mice measured after 3 weeks of the first injections (n = 8/group). C Liver weights and LW/BW ratios of mice were measured at the end of ND or HFD feeding (n = 8/group). D Changes in TG, NEFA, and TC levels were determined by ELISA in the livers of mice after injection with AD-anti-miR-NC or AD-anti-miR-28a-5p for 3 weeks (n = 8/group). E, F Histological images of liver sections from mice injected with AD-anti-miR-NC or AD-anti-miR-28a-5p for 3 weeks (n = 8/group) stained by H&E and with Oil Red O to visualise lipid droplets; Scale bar, 50 µM. G The mRNA levels of lipid metabolism-associated genes were measured by RT‒qPCR analysis (n = 8/group). H The mRNA levels of inflammation-related genes analysed by RT‒qPCR (n = 8/group). I Liver function, manifested by serum AST, ALT, and ALP levels, was evaluated using ELISA in adenovirus-injected mice (n = 8/group). J Fasting blood glucose levels of mice (n = 8/group). K, L Fasting insulin levels and HOMA-IR scores of adenovirus-injected mice (n = 8/group). M–P GTT and ITT of adenovirus-injected mice post ND or HFD feeding, and the areas under the curve (AUCs) for the GTT and ITT (N = 8/group). Q RT‒qPCR analysis of PEPCK and G6Pase expression in the livers of mice (N = 8/group). The data are presented as the mean ± S.D. of three independent experiments. A p value of <0.05 was considered statistically significant; and *p < 0.05, **p < 0.01, ***p < 0.001 assessed via a ANOVA with the Bonferroni post hoc test for comparisons among more than two groups (A–Q); ns not significant.

