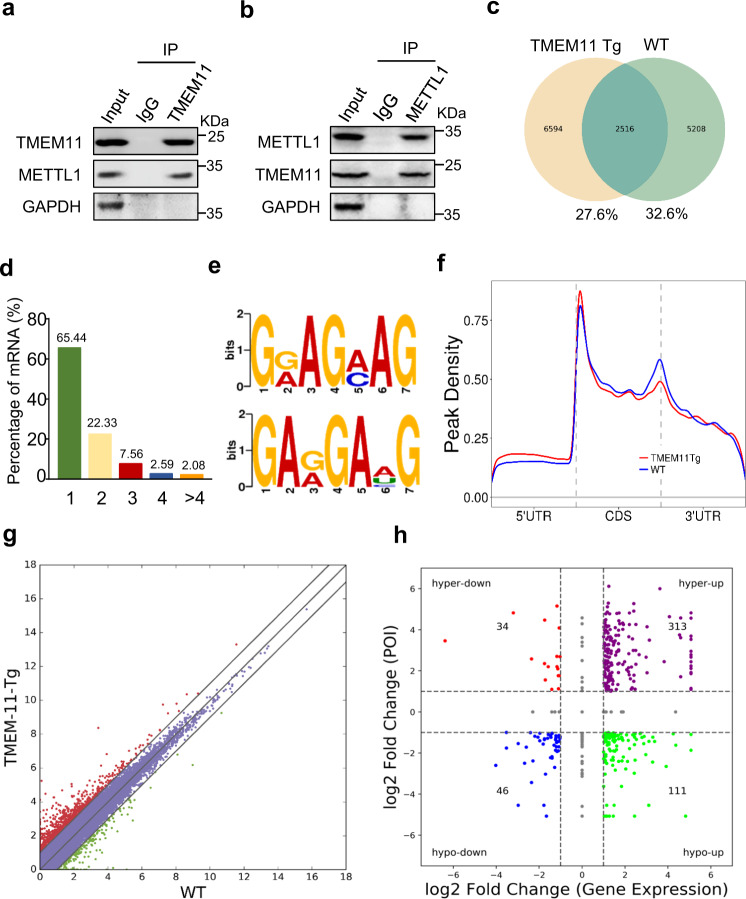
Fig. 5. Transcriptome-wide m7G methylome analyses (using m7G-Seq) in TMEM11 Tg mice heart.
Immunoprecipitation assessment using anti-TMEM11 antibody (a) and anti- METTL1 antibody (b) showing the interaction of TMEM11 and METTL1. Representative immunoblots from four independent experiments with similar results. c–f m7G methylated RNA immunoprecipitation and sequencing (MeRIP-seq) was performed in TMEM11 Tg and WT mice hearts. c Numbers of m7G peaks detected in TMEM11 Tg (left circle) and WT (right circle) mice hearts. d Percentage of mRNAs with different numbers of m7G peaks. e Sequence motifs enriched within m7G peaks identified by MeRIP-seq in TMEM11 Tg mice hearts. f Metagene profile showing the distribution of m7G peaks across the length of transcripts composed of three rescaled non-overlapping segments 5′UTR, CDS and 3′UTR in TMEM11 Tg and WT mice hearts. g Scatter plot of differential expression of mRNAs assessed from RNA-seq data. Red dots denote up-regulated genes and green dots denote down-regulated genes. h Correlation between the level of gene expression and changes in m7G level in TMEM11 Tg mice hearts compared to WT.

