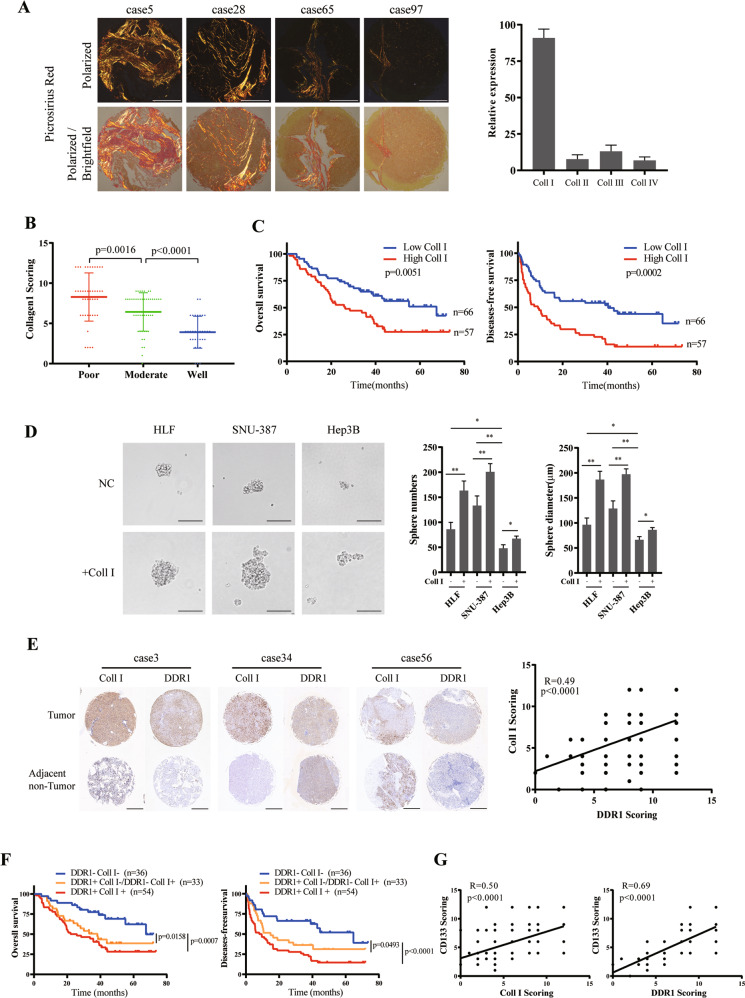
Fig. 1. Clinical significance of Collagen I and DDR1 in clinical HCC patients.
A Representative picrosirius red staining for collagen types in specimens of 123 HCC patients (scale bar = 500 μm). B Immunohistochemistry (IHC) staining analyses of collagen I in specimens of HCC patients with tumor differentiation. C Based on IHC staining, cohorts were divided into two groups: Collagen I high (IHC score >6), n = 57; Collagen I low (IHC score ≤6), n = 66. Kaplan–Meier’s analyses of collagen I expression level with the overall survival and disease-free survival rate in HCC patients. D Effects of SNU-387, HLF, or Hep3B with or without collagen I stimulation on sphere-forming capacity, including sphere numbers and diameters (scale bar = 200 μm). E Representative result of IHC staining for collagen I and DDR1 in 123 pair specimens of HCC patients (scale bar = 500 μm) (Left). Correlation of collagen I and DDR1 IHC staining score (Right). F Kaplan–Meier’s analyses of 3 groups of collagen I and DDR1 expression levels with the overall survival and disease-free survival rate in HCC patients. Redline: Collagen I high DDR1 high, n = 54; Orange line: Collagen I low DDR1 high or Collagen I high DDR1 low, n = 33; Blue line: Collagen I low DDR1 low, n = 36. G Correlation of collagen I, DDR1 and CD133 IHC staining score. Pearson’s test was used to calculate the correlation between protein expression levels. The log-rank test was used to calculate the differences between individual groups. Two-tailed unpaired Student’s t-test was performed. Each bar represents the mean ± SD. *p < 0.05, **p < 0.01 and ***p < 0.001.

