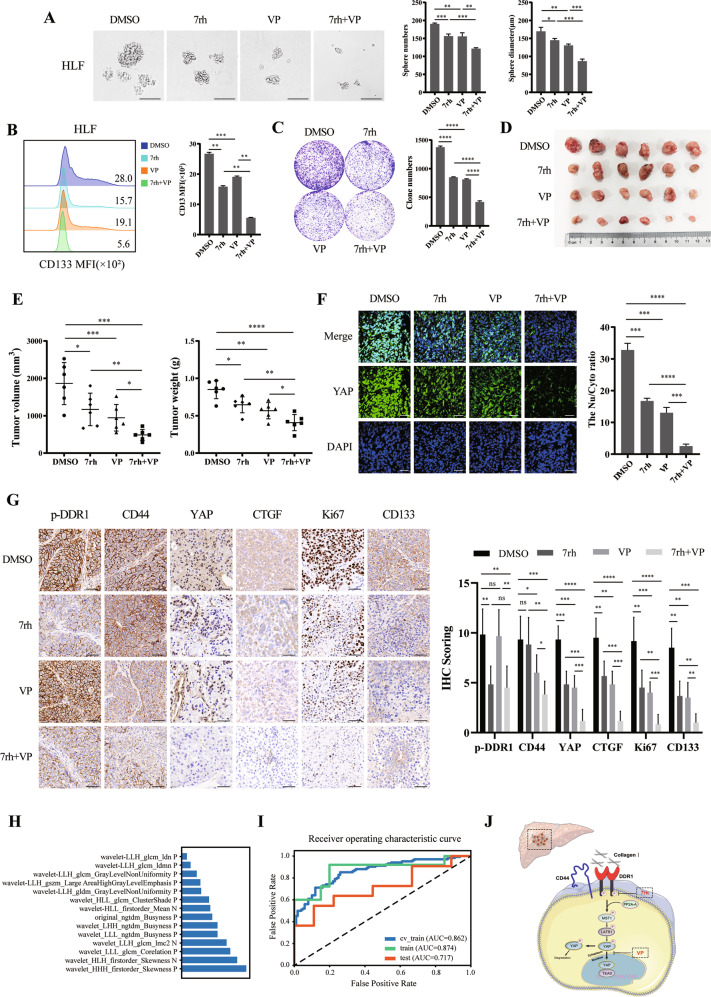
Fig. 8. Co-inhibition of DDR1 and Hippo/YAP signaling impedes tumor proliferation and radiomics model of prediction on Collagen I expression.
A Effects of treatment with 7rh, VP, or combination therapy in HLF cells on sphere-forming capacity, sphere numbers, and diameters were counted. (Scale bar = 200 μm). B Flow cytometry analyses of the CD133 mean fluorescence intensity in 7rh, VP, or combination therapy treatment in HLF cells. C Colony formation assay of the 7rh, VP, or combination therapy treatment in HLF cell lines. D 4 -week-old male BALB/c nude mice were subcutaneously injected by sphere-formed HLF cells, divided into DMSO, 7rh, VP, and combination groups randomly for 2 weeks of treatment (n = 6/group). E Tumor weight and volume were analyzed from BALB/c nude mice with DMSO, 7rh or VP treatment. F Representative images of immunofluorescence assays display nucleus/cytoplasm localization of YAP in tumor from BALB/c nude mice xenograft (scale bar = 100 μm). G Representative images of IHC staining of p-DDR1, CD44, YAP, CTGF, Ki67, and CD133 form BALB/c nude mice xenograft (scale bar = 100 μm). H The important 14 features of the SVM classifier model in diagnosing HCC collagen I expression. I The ROC curves of models in train and test sets, respectively. J The schematic diagram shows that collagen I/DDR1 enhances HCC stemness through Hippo signaling. Two-tailed unpaired Student’s t-test was performed. Each bar represents the mean ± SD. *p < 0.05, **p < 0.01 and ***p < 0.001.

