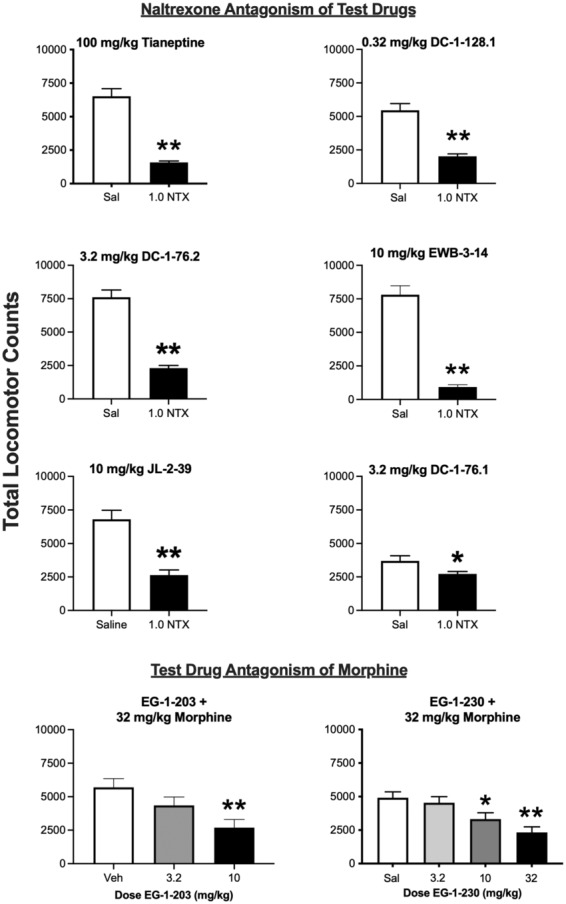
FIGURE 6.

Antagonism studies with test drugs. For the six higher‐efficacy test drugs (top six panels), a locomotor‐activating dose of the drug was tested after pretreatment with either saline (Sal) or 1.0 mg/kg naltrexone (1.0 NTX). For the two lowest efficacy drugs (bottom two panels), a locomotor‐activating dose of morphine (32 mg/kg) was administered after pretreatment with either vehicle (Veh) or increasing test‐drug doses. All points show mean ± SEM. *p < .05, **p < .01 compared to saline (top panels) or vehicle (bottom panels) after t‐test or one‐way ANOVA as appropriate.
