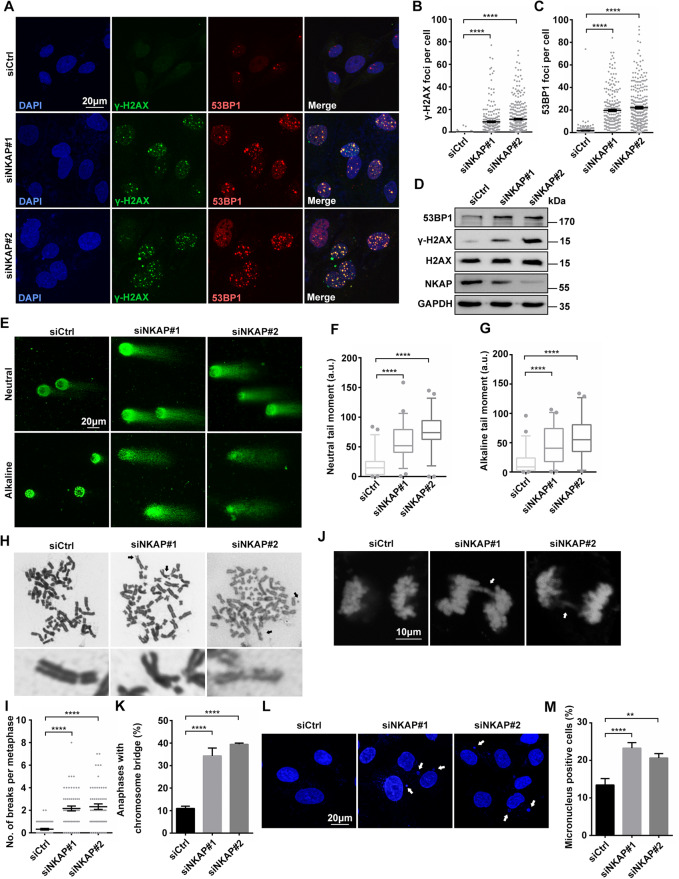
Fig. 1. Knockdown of NKAP leads to DNA damage and genome instability.
A–C Representative images (A) and quantification (B, C) of γH2AX and 53BP1 foci in U2OS cells following transfection with control or NKAP siRNAs for 48 h. The graph shows the number of foci per cell. ****P < 0.0001 (Mann–Whitney U-test, two-tailed). D Western blot analysis using indicated antibodies. Lysates were prepared from cells following transfection with control or NKAP siRNAs for 48 h. GAPDH serves as a loading control. E–G Representative images (E) and quantification (F, G) of DNA breaks measured by neutral and alkaline comet assay in cells following transfection with control or NKAP siRNAs for 48 h. ****P < 0.0001 (Mann–Whitney U-test, two-tailed). H and I Representative images (H) and quantification (I) of metaphase chromosomes in cells following transfection with control or NKAP siRNAs. Arrows indicate examples of chromosomes with breaks, and zoom in images are shown below. The graph shows the number of chromosome breaks per metaphase. ****P < 0.0001 (Mann–Whitney U-test, two-tailed). J and K Representative images (J) and quantification (K) of chromosomes with anaphase bridges in cells following transfection with control or NKAP siRNAs for 48 h. The graph shows the percentage of anaphase cells with chromosome bridges. ****P < 0.0001 (paired Student’s t test). L and M Representative images (L) and quantification (M) of nuclei with micronuclei in cells following transfection with control or NKAP siRNAs for 48 h. The graph shows the percentage of cells containing micronuclei. ****P < 0.0001; **P < 0.01 (paired Student’s t test). Scale bar, 20 μm in (A, E and L); 10 μm in (J). a.u. indicates arbitrary units. Data are presented as Mean ± standard error of the mean (SEM).

