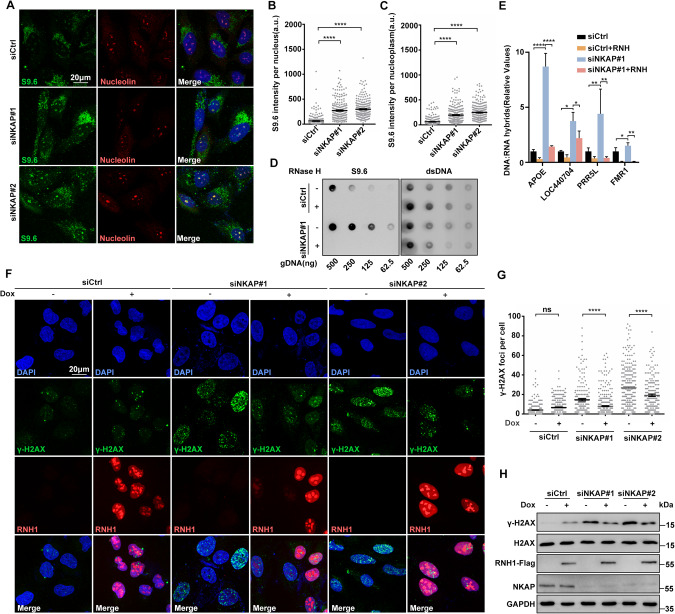
Fig. 2. NKAP depletion induced R-loop accumulation contributes to DNA damage.
A–C Representative images (A) and quantification (B and C) of S9.6 fluorescence staining in cells following transfection with control or NKAP siRNAs for 48 h. anti-Nucleolin antibody was used to detect Nucleolin and label the nucleolus. The graph shows the S9.6 fluorescence intensity per nucleus (B) and nucleoplasm (C). The value for the nucleoplasm was determined by the signal intensity per nucleus with subtraction of the nucleolar signal. ****P < 0.0001 (Mann–Whitney U-test, two-tailed). D Dot blot analysis of R-loops using the S9.6 antibody. Genomic DNA was extracted from cells following transfection with control or NKAP siRNAs for 48 h. RNase H treatment was conducted alongside and used as a negative control. dsDNA was used as an internal sample loading control. E DRIP-qPCR analysis of the indicated loci in cells following transfection with control or NKAP siRNAs for 48 h. In vitro RNase H treatment was conducted prior to pulldown and served as a control. The graph shows the relative value of R-loop level in each gene loci which was normalized with respect control. ****P < 0.0001; **P < 0.01; *P < 0.05 (paired Student’s t test). F and G Representative images (F) and quantification (G) of γH2AX foci in cells following transfection with control or NKAP siRNAs for 48 h and subsequent treatment with (+) or without (−) doxycycline (DOX) to induce RNH1 overexpression. The graph shows the number of foci per cell. ***P < 0.001 (Mann– Whitney U-test, two-tailed). H Western blot analysis using indicated antibodies. Lysates were prepared from cells following transfection with control or NKAP siRNAs for 48 h and subsequent treatment with (+) or without (−) doxycycline (DOX) to induce RNH1 overexpression. Each value shows the quantification of γH2AX in relative to H2AX. GAPDH serves as a loading control. Scale bar, 20 μm. a.u. indicates arbitrary units. Data are presented as Mean ± standard error of the mean (SEM).

