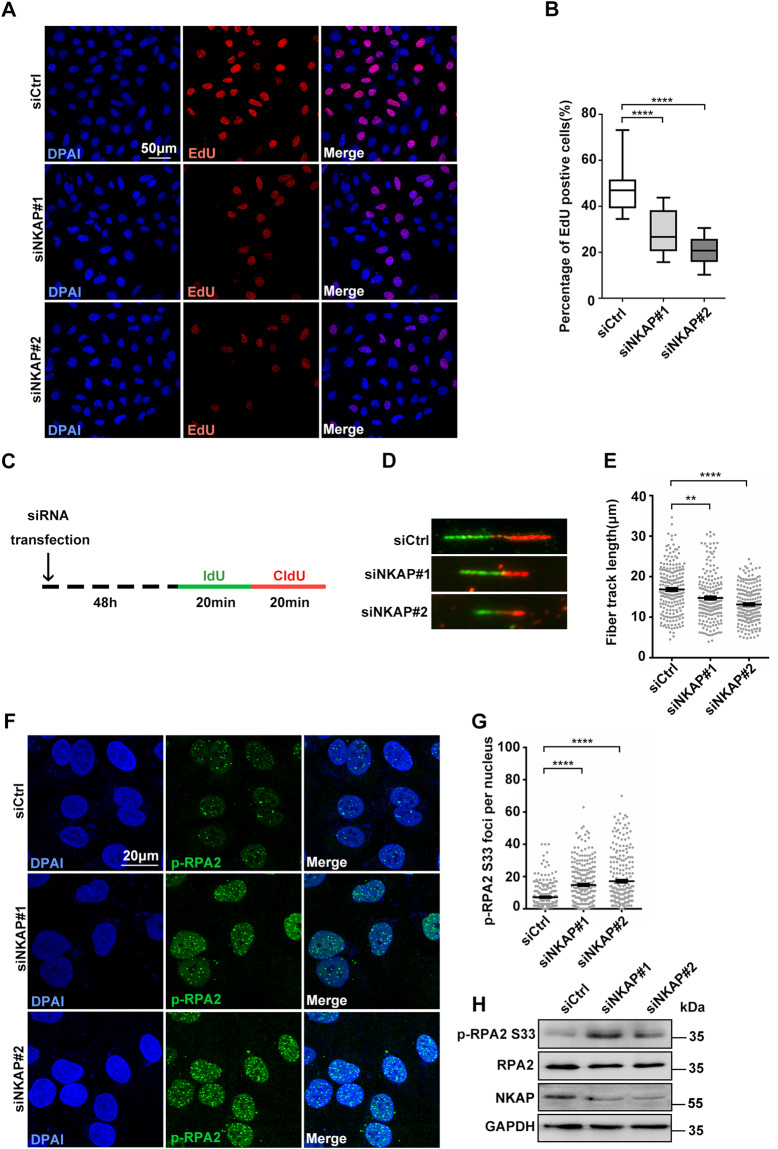
Fig. 3. Defective DNA replication in NKAP depletion cells.
A and B Representative images (A) and quantification (B) of EdU incorporation in cells following transfection with control or NKAP siRNAs for 48 h. The graph shows the percentage of EdU positive cells. ****P < 0.0001 (paired Student’s t test). C Schematic representation of the DNA fiber assay. Cells were transfected with control or NKAP siRNAs for 48 h and then incubated with 5′-iodo-2′-deoxyuridine (25 μM IdU, 20 min) followed by 5′-chloro-2′-deoxyuridine (250 μM CldU, 20 min) as indicated. D and E Representative images (D) and quantification (E) of DNA fibers in cells following transfection with control or NKAP siRNAs for 48 h. DNA fibers were labeled by IdU (Green) and CldU (Red). The graph shows the track length of DNA fibers. ****P < 0.0001; **P < 0.01 (Mann–Whitney U-test, two-tailed). F and G Representative images (F) and quantification (G) of p-RPA2 foci in cells following transfection with control or NKAP siRNAs for 48 h. The graph shows the number of p-RPA2 foci per nucleus. ****P < 0.0001 (Mann–Whitney U-test, two-tailed). H Western blot analysis using indicated antibodies. Lysates were prepared from cells following transfection with control or NKAP siRNAs for 48 h. GAPDH serves as a loading control. Scale bar, 50 μm in (A); 20 μm in (F). a.u. indicates arbitrary units. Data are presented as Mean ± standard error of the mean (SEM).

