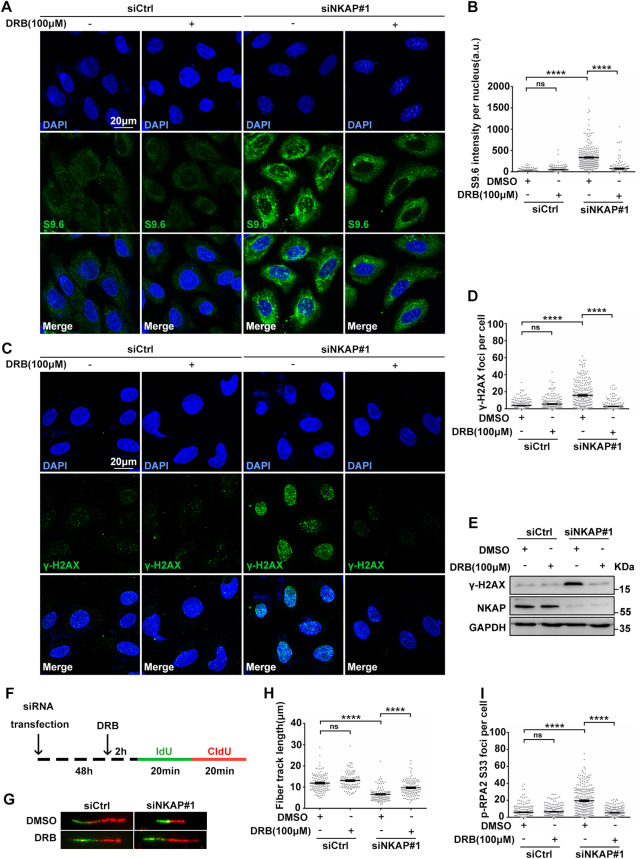
Fig. 4. NKAP depletion induced R-Loops accumulation and DNA damage are dependent on transcription.
A and B Representative images (A) and quantification (B) of S9.6 fluorescence staining in cells following transfection with control or NKAP siRNAs for 46 h and subsequent treatment with or without DRB (100 μM) for 2 h. The graph shows the S9.6 intensity per nucleus. ****P < 0.0001 (Mann–Whitney U-test, two-tailed). C and D Representative images (C) and quantification (D) of γH2AX foci in cells following transfection with control or NKAP siRNAs for 46 h and subsequent treatment with or without DRB (100 μM) for 2 h. The graph shows the number of γH2AX foci per cell. ****P < 0.0001 (Mann–Whitney U-test, two-tailed). E Western blot analysis using indicated antibodies. Lysates were prepared from cells following transfection with control or NKAP siRNAs for 46 h and subsequent treatment with or without DRB (100 μM) for 2 h. GAPDH serves as a loading control. F Schematic representation of the DNA fiber assay. Cells were transfected with control or NKAP siRNAs for 46 h and then treated with or without DRB (100 μM) for 2 h before incubating with IdU (25 μM, 20 min) followed by CldU (250 μM, 20 min) as indicated. G and H Representative images (G) and quantification (H) of DNA fibers in cells following transfection with control or NKAP siRNAs for 46 h and subsequent treatment with or without DRB (100 μM) for 2 h. DNA fibers were labeled by IdU (Green) and CldU (Red). The graph shows the track length of DNA fibers. ****P < 0.0001 (Mann–Whitney U-test, two-tailed). I Quantification of p-RPA2 foci in cells following transfection with control or NKAP siRNAs for 46 h and subsequent treatment with or without DRB (100 μM) for 2 h. ****P < 0.0001 (Mann–Whitney U-test, two-tailed). Scale bar, 20 μm. a.u. indicates arbitrary units. Data are presented as Mean ± standard error of the mean (SEM).

