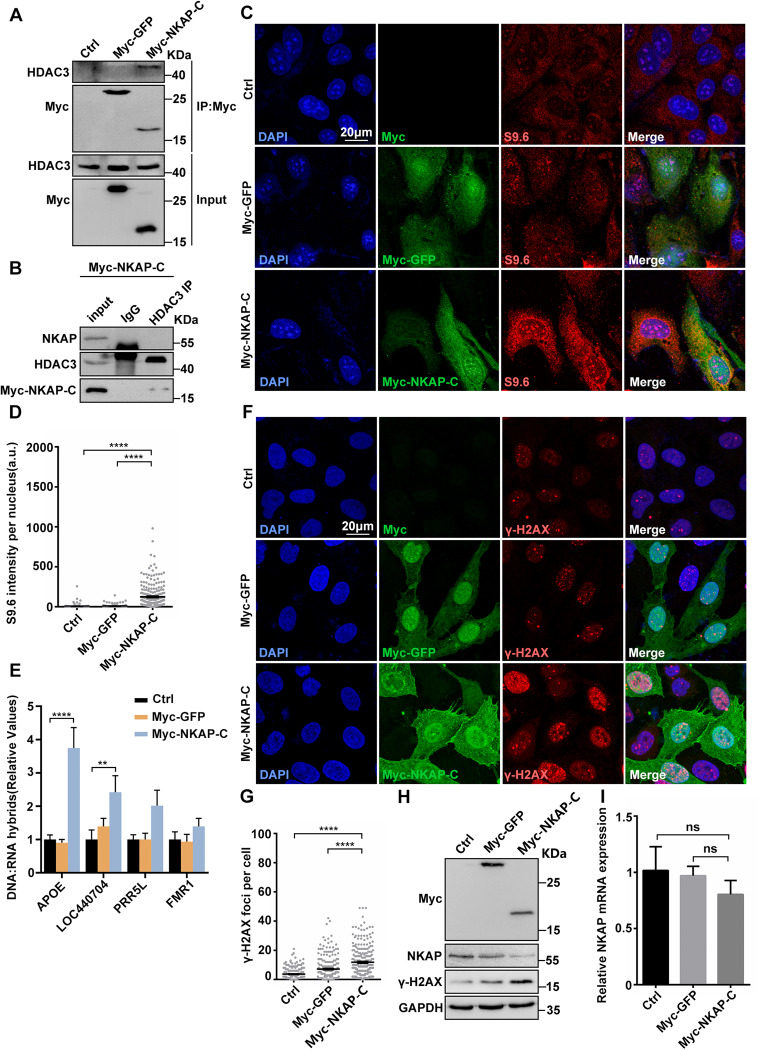
Fig. 6. Overexpression of NKAP C-terminal DUF926 domain causes R-loop accumulation and DNA damage.
A Western blot analysis of co-IP between HDAC3 and Myc-GFP or Myc-NKAP-C expressed in HEK293T cells. Lysates were prepared from cells transfected with control, pCMV-Myc-GFP or pCMV-Myc-NKAP-DUF926 plasmids. The IP was performed using anti-Myc antibody with cell lysates. B Western blot analysis of co-IP between endogenous HDAC3 and NKAP proteins in pCMV-Myc-NKAP-DUF926 overexpression U2OS cells. The IP was performed using anti-HDAC3 antibody with cell lysates. C and D Representative images (C) and quantification (D) of S9.6 fluorescence staining in cells transfected with control, pCMV-Myc-GFP or pCMV-Myc-NKAP-DUF926 plasmids. The graph shows the S9.6 fluorescence intensity per nucleus. ****P < 0.0001 (Mann–Whitney U-test, two-tailed). E DRIP-qPCR analysis of the indicated loci in cells following transfection with control, pCMV-Myc-GFP or pCMV-Myc-NKAP-DUF926 plasmids. The graph shows the relative value of R-loop level in each gene loci which was normalized with respect control. ****P < 0.0001; **P < 0.01; *P < 0.05 (paired Student’s t test). F and G Representative images (F) and quantification (G) of γH2AX foci in cells transfected with control, pCMV-Myc-GFP or pCMV-Myc-NKAP-DUF926 plasmids. The graph shows the number of foci per cell. ****P < 0.0001 (Mann–Whitney U-test, two-tailed). H Western blot analysis using indicated antibodies. Lysates were prepared from cells transfected with control, pCMV-Myc-GFP or pCMV-Myc-NKAP-DUF926 plasmids. GAPDH serves as a loading control. I RT-qPCR analysis of NKAP and HDAC3 mRNA levels. Total RNAs were isolated from cells following transfection with control, pCMV-Myc-GFP or pCMV-Myc-NKAP-DUF926 plasmids. GAPDH serves as a control. ***P < 0.001(paired Student’s t test). Scale bar, 20 μm. a.u. indicates arbitrary units. Data are presented as Mean ± standard error of the mean (SEM).

