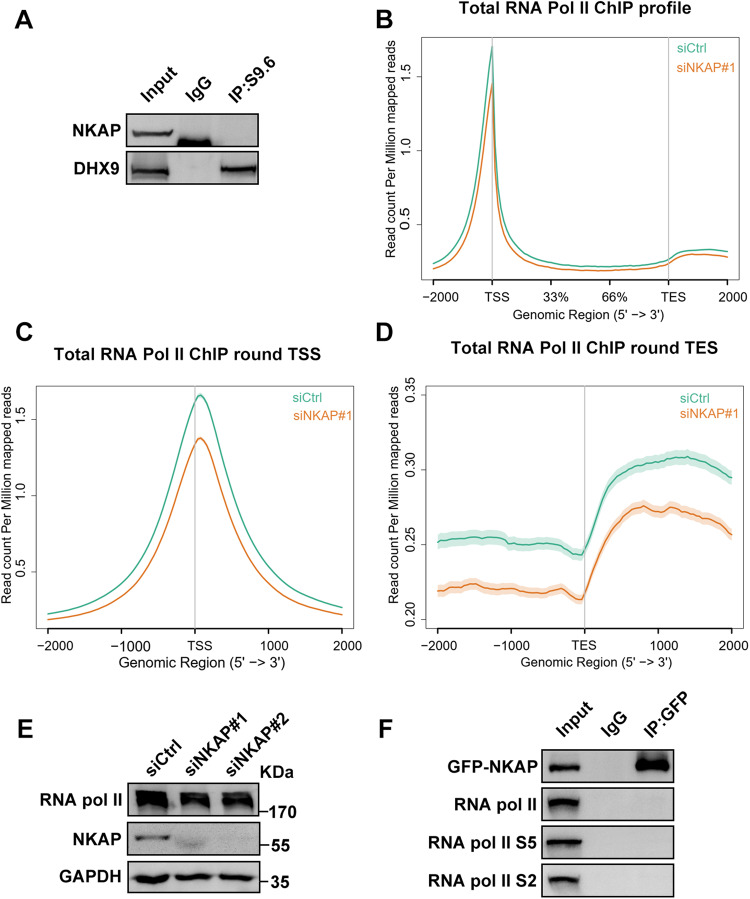
Fig. 8. Depletion of NKAP reduces Pol II occupancy at TSS and TES sites.
A Western blot analysis of RNA:DNA hybrid IP using anti-NKAP or anti-DHX9 antibodies. The IP was performed using S9.6 antibodies with cell lysates. B Average distribution of total RNA Pol II from transcription start site (TSS) to transcription end site (TES) of all RefSeq transcripts in control and NKAP knockdown cells. C Average distribution of total RNA Pol II around TSS in control and NKAP knockdown cells. D Average distribution of total RNA Pol II around TES in control and NKAP knockdown cells. E Western blot analysis using indicated antibodies. Lysates were prepared from cells following transfection with control or NKAP siRNAs for 48 h. GAPDH serves as a loading control. F Western blot analysis of GFP-NKAP IPs using antibodies against total RNA Pol II, RNA Pol II S5 or RNA Pol II S2. The IP was performed using anti-GFP antibodies with cell lysates.

