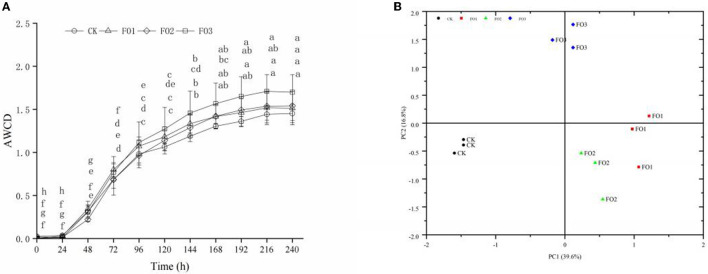
Figure 1.
Average well color development (AWCD) (A) and principal component analysis (B) of carbon sources utilization profiles of soil microbes in Biolog Ecoplate of soil samples under different treatments. (A) Different lowercase letters indicate significant differences between different incubation times in the same treatment (P < 0.05). CK, control (circles); FO1, combination of 60% chemical fertilizer with organic manure of 150 kg/ha (triangles); FO2, combination of 60% chemical fertilizer with organic manure of 300 kg/ha; FO3, combination of 60% chemical fertilizer with organic manure of 450 kg/ha (squares). (B) CK, control (filled circles); FO1, FOL combination of 60% chemical fertilizer with organic manure of 150 kg/ha (filled squares); FO2, combination of 60% chemical fertilizer with organic manure of 300 kg/ha (filled triangles); FO3, combination of 60% chemical fertilizer with organic manure of 450 kg/ha (filled diamonds); PC, principal component.

