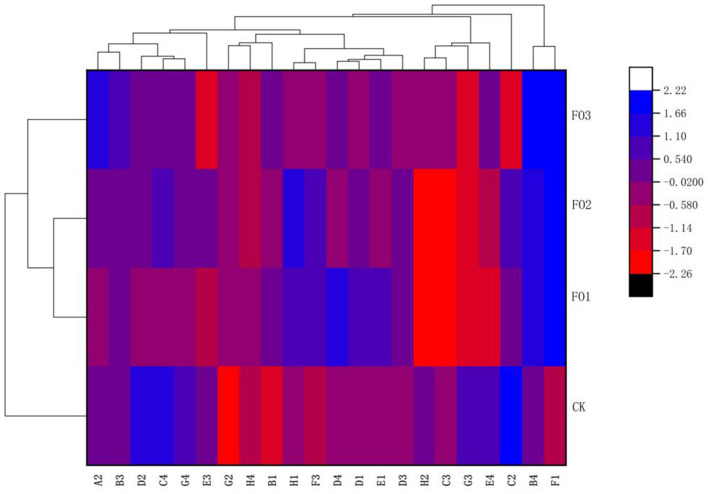
Figure 2.
Cluster diagram of soil microbial carbon sources utilization under different treatments. The carbon sources are listed on the X-axis and treatments on the Y-axis. For the heat map, the left side of the cluster tree is a treatment cluster tree and the above cluster tree is the carbon sources duster tree. A2, represents β-methyl-D-glucoside; B3, D-galacturonic acid; D2, D-mannitol; C4, L-phenylalanine; G4, phenylethyl-amine; E3, y-hydroxybutyric acid; G2, Glucose-1-Phosphate; H4, Putrescine, B1, pyruvic acid methyl ester; H1, a-D-Lactose; F3, itaconic acid; D4, L-Serine; D1, Tween 80; E1, a-Cyclodextrin; D3, 4-hydroxybenzoic acid; H2, D,L-a-glycerol; C3, 2-hydroxybenzoic acid; G3, a-ketobutyric acid; E4, L-threonine; C2, I-Erythritol; B4, L-asparagine; Fl, represents Glycogen. While CK, shows control; FO1, combination of 60% chemical fertilizer with organic manure of 150 kg/ha; FO2, combination of 60% chemical fertilizer with organic manure of 300 kg/ha; and corresponding FO3, combination of 60% chemical fertilizer with organic manure of 450 kg/ha. The numbers for different colors of the columns represent the abundance of the genera or genes in different samples.

