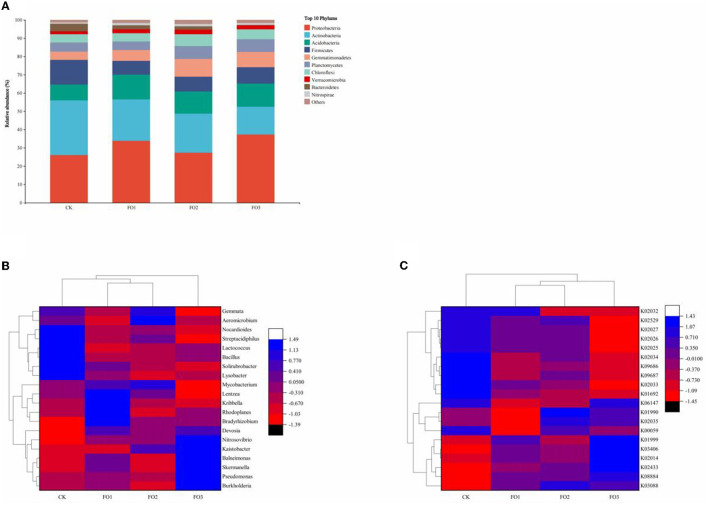
Figure 3.
Changes in the relative abundance of soil bacteria at the phylum level (A) among different treatments. The heatmap of relative abundances of the top 20 identified bacteria at the genus level (B) and bacterial community KEGG Orthologs (KOs) for different soil samples (C). CK, shows control; FO1, combination of 60% chemical fertilizer with organic manure of 150 kg/ha; FO2, combination of 60% chemical fertilizer with organic manure of 300 kg/ha; FO3, combination of 60% chemical fertilizer with organic manure of 450 kg/ha. Numbers of different colors of the columns represent the abundance of the genera or genes in different samples.

