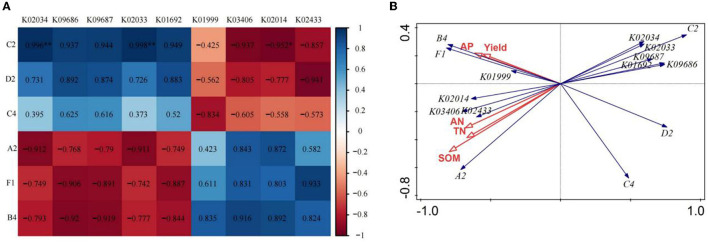
Figure 4.
Correlation analysis of dominant soil carbon metabolism and dominant KEGG Orthologs (KOs) in rain-fed wheat field (A); redundancy analysis of soil nutrient and yield with dominant carbon source utilization and dominant bacteria KEGG Orthologs (B). A2, represents β-Methyl-D-Glucoside; D2, D-Mannitol; C4, L-phenylalanine; C2, I-Erythritol; B4, L-asparagine; Fl, represents glycogen. TN, total nitrogen; AN, available nitrogen; AP, available phosphorus; SOM, soil organic matter. While CK, shows control; FO1, combination of 60% chemical fertilizer with organic manure of 150 kg/ha; FO2, combination of 60% chemical fertilizer with organic manure of 300 kg/ha; and corresponding FO3, combination of 60% chemical fertilizer with organic manure of 450 kg/ha. The numbers for different colors of the columns represent the abundance of the genera or genes in different samples.

