
FIGURE 2.
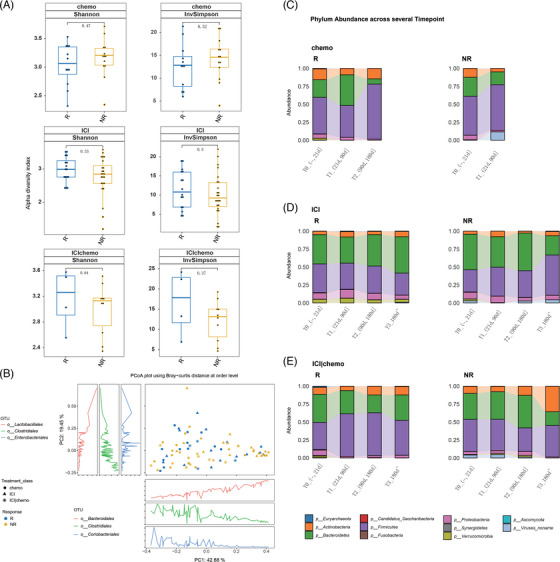
Gut microbiome composition associated with treatment and drug response. (A) Gut microbiome alpha diversity between responders and non‐responders at baseline for the three treatments, respectively (Wilcoxon test). (B) PCoA plot of baseline fecal samples depicts beta diversity evaluated by Bray‐Curtis distance arranged by response and treatment. The x‐ and y‐axes show the first and second principal coordinates, respectively, alongside percentage of variances explained for each dimension. NR, non‐responders; R, responders. (C) Dynamic microbial composition of Rs and NRs in chemotherapy group at the phylum level. (D) Dynamic microbial composition of Rs and NRs in ICI group at the phylum level. (E) Dynamic microbial composition of Rs and NRs in ICI plus chemotherapy group at the phylum level.