
FIGURE 5.
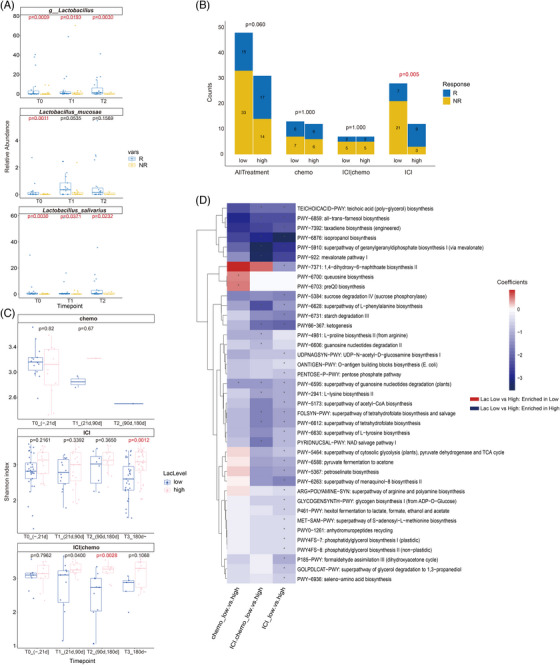
Characteristics of patients with higher abundance of Lactobacillus. (A) Relative abundance of genus Lactobacillus, Lactobacillus mucosae and Lactobacillus salivarius in the ICI group at different timepoints. Comparisons were performed using MaAsLin2. T0 = 0∼21 days, T1 = 21∼90 days, T2 = 90∼days. (B) Number of responders and non‐responders in Lac‐High and Lac‐Low group for each treatment group. Comparisons were performed using Fisher's exact test. (C) Gut microbiome alpha diversity comparison at different timepoints between Lac‐low and Lac‐high patients using Wilcoxon test. (D) Heatmap of differentially bacteria functional pathways between Lac‐high and Lac‐low patients of chemotherapy, immunotherapy, and immunotherapy plus chemotherapy groups. Asterisks denote significantly different (MaAsLin2 coefficient FDR‐adjusted p value < .01). The colour of each rectangle represents the coefficient value calculated by MaAsLin2 analysis. Red, pathways enriched in Lac‐low group; blue, pathways enriched in the Lac‐high group. Lac‐High group: patients with elevated abundances of Lactobacillus spp. (i.e., greater than the median value for). Lac‐low group: patients with depleted abundances of Lactobacillus (i.e., lower than the median value for all samples).