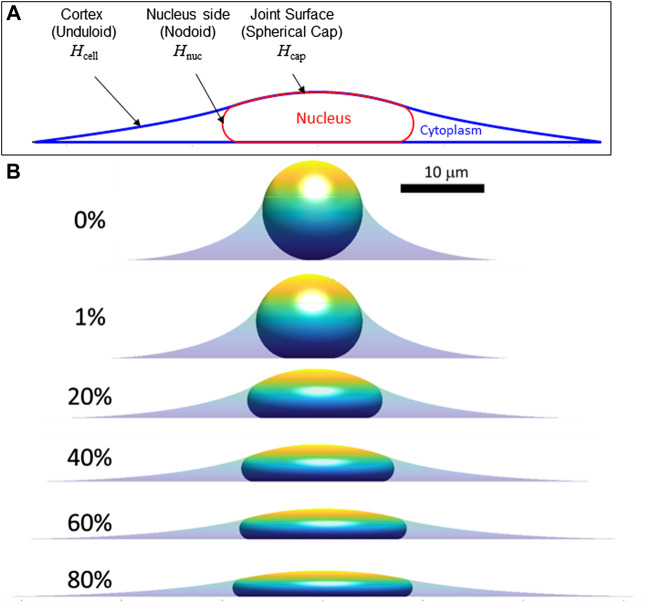
FIGURE 3.
Calculated axisymmetric cell and nuclear x-z profiles in spread cells are shown for increasing amounts of fractional excess areas indicated by the percentages. (A) Characteristic calculated shape (x-z profile) showing the cell and nucleus surfaces. Consistent with experimental x-z profiles (Figure 1), spread cells with smooth nuclear lamina have surfaces of constant mean curvature, including the cortical cell surface (mean curvature, H cell), the nuclear surface (containing the lamina) in contact with the cytoplasm (H nuc), and the joint cortex/nuclear apical surface capping the cell (H cap.) The cell and nuclear shapes were found by solving for the mean curvatures of each surface that satisfy the constant volume and surface area constraints (see Methods). (B) Calculated cell and nuclear shapes with varying lamina excess surface area. For the profiles shown, the spreading cell radius was taken as the radius where the slope of the cell edge just becomes parallel to the substratum. As shown, increasing excess lamina area permits flatter nuclei and greater spreading radius for the same nuclear and cell volume (V and V cell, respectively). For the calculations shown here V = 900 μm3, V cell = 3.4V, consistent with values for NIH 3T3 fibroblasts (Li et al., 2015). Comparison to experimental profiles like in Figure 1 suggests nuclei typically have 30%–60% excess surface area, which allows a flat equilibrium nuclear shape that is geometrically determined and independent of the magnitude of cellular forces.

