
Figure 1.
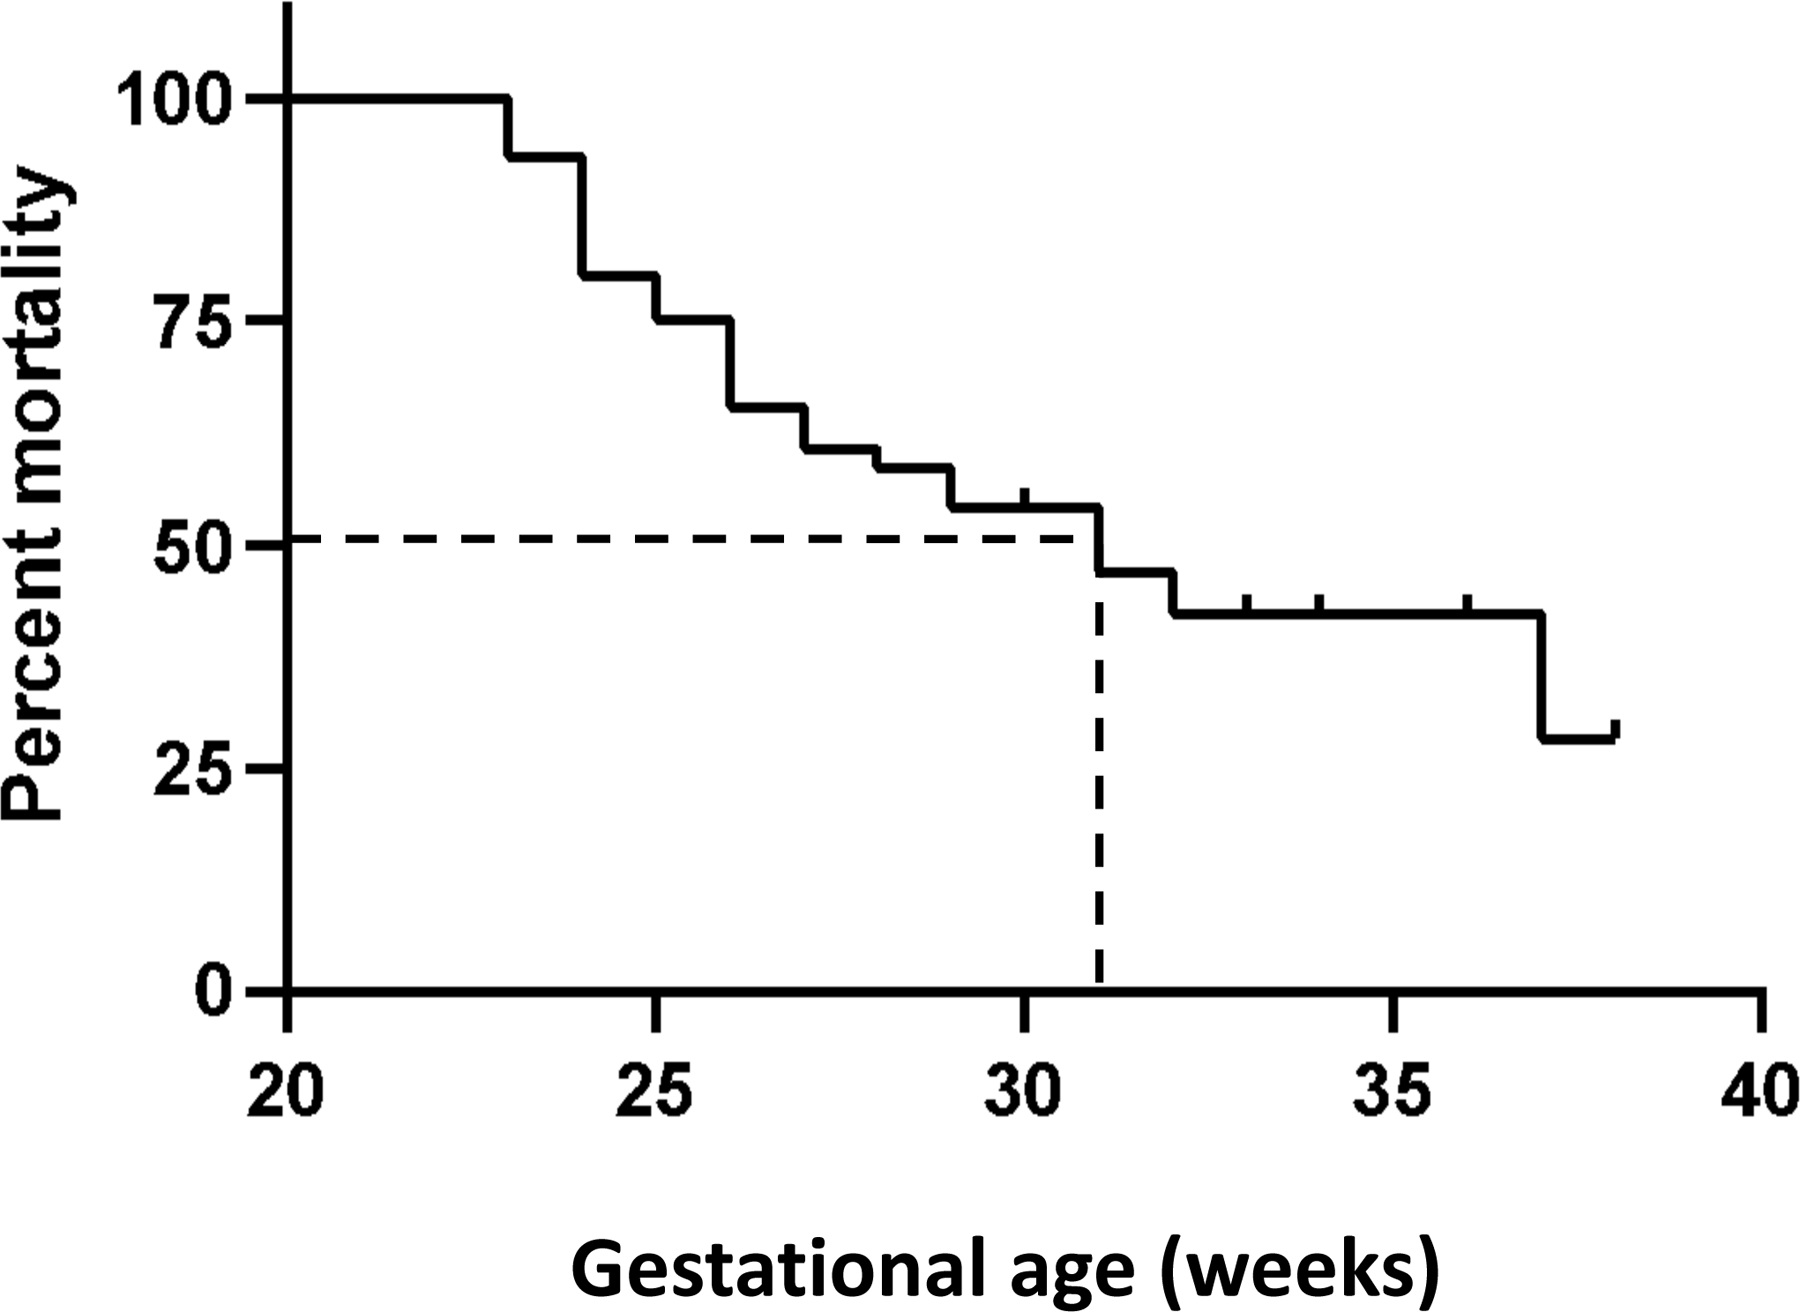
Kaplan -Meier curve shows gestational age (weeks) plotted against mortality (percentage). Dashed lines show the gestational age corresponding to 50% mortality.
Official websites use .gov
A
.gov website belongs to an official
government organization in the United States.
Secure .gov websites use HTTPS
A lock (
) or https:// means you've safely
connected to the .gov website. Share sensitive
information only on official, secure websites.
Kaplan -Meier curve shows gestational age (weeks) plotted against mortality (percentage). Dashed lines show the gestational age corresponding to 50% mortality.