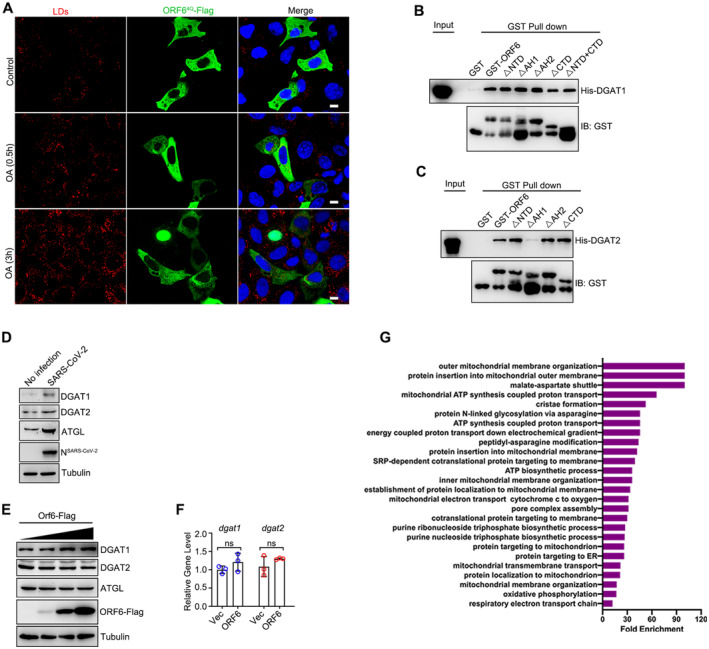
Figure EV2. ORF6 promotes LD biogenesis.

-
ACells expressing the ORF64Q‐Flag were treated with 200 μM OA for indicated times, then fixed and stained with anti‐Flag (green). LDs were labeled with LipidTOX Deep Red (red). The nuclei of cells were stained with DAPI. Cells were imaged by confocal microscopy. Scale bar represents 10 μm.
-
B, CThe interactions of GST tagged ORF6 or the mutants with the His tagged DGAT1 and His tagged DGAT2 were analyzed by GST pull‐down assay.
-
DVero‐E6 cells were infected or non‐infected with SARS‐CoV‐2 for 24 h. Cell lysates were analyzed via WB.
-
EHeLa cells were transfected with gradient of ORF6‐Flag for 24 h. Protein levels of endogenous DGAT1, DGAT2, and ATGL were analyzed via WB.
-
FHeLa cells were transfected with gradient of ORF6‐Flag for 24 h. RNA levels of dgat1 and dgat2 were analyzed via QPCR, three independent experiments. Two‐tailed Unpaired Student's t‐test, ns means no significance. Error bars represent the mean ± SD.
-
GGene Ontology (GO) enrichment analysis was performed on the human interacting proteins of SARS‐CoV‐2 ORF6 protein, P‐values calculated by hypergeometric test and a false discovery rate was used to account for multiple hypothesis testing. The top GO term was shown in the graph.
Source data are available online for this figure.
