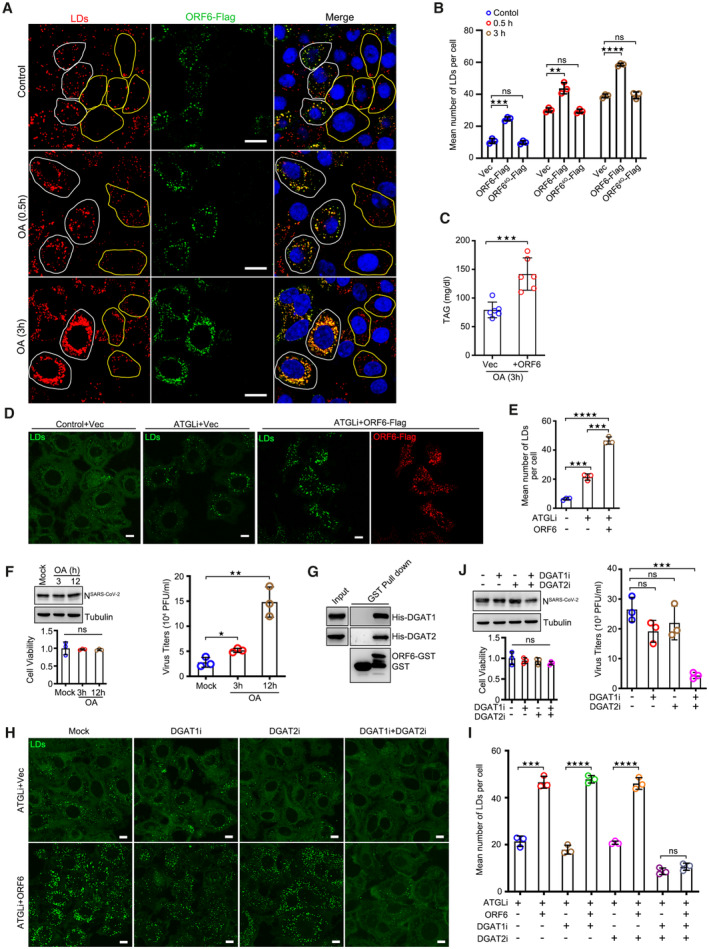
Figure 3. ORF6 promotes LD biogenesis by binding to DGAT1 and DGAT2.

- HeLa cells were transfected with vector or ORF6‐Flag for 24 h, and then treated with 200 μM OA for indicated times. Cells were fixed and stained with anti‐Flag (green). LDs were labeled with LipidTox Deep Red (red). The nuclei were stained with DAPI. Cells were imaged by confocal microscopy. Scale bar represents 10 μm. White ROIs indicate cells expressing ORF6 and yellow ROIs indicate the cells without ORF6 expression.
- Mean number of LDs in each cell in (A) was counted from 25 cells of three independent experiments. Two‐tailed Unpaired Student's t‐test, **P < 0.01, ***P < 0.001, ****P < 0.0001, ns means no significance. Error bars represent the mean ± SD.
- HeLa cells stable expressing the ORF6‐Flag were treated with 200 μM OA for 3 h. The concentration of TAG in cells was analyzed. Error bars, mean ± SD of six independent experiments. Two‐tailed Unpaired Student's t‐test, ***P < 0.001.
- HeLa cells stable expressing vector or ORF6‐Flag were treated or untreated with 50 μM ATGL inhibitor (ATGLi) for 24 h, and then were fixed and stained with anti‐Flag (red). LDs were labeled with BODIPY‐493/503 (green). Cells were imaged by confocal microscopy. Scale bar represents 10 μm.
- Mean number of LDs in each cell in (D) was counted from 25 cells of three independent experiments. Two‐tailed Unpaired Student's t‐test, ***P < 0.001, ****P < 0.0001. Error bars represent the mean ± SD.
- SARS‐CoV‐2‐infected Vero‐E6 cells were incubated with 200 μM OA for indicated times. Cell viability was analyzed. Cell lysates were analyzed via WB. Supernatants were determined by plaque assays. Virus titer values represent mean ± SD for three independent experiments. Two‐tailed Unpaired Student's t‐test, *P < 0.05, **P < 0.01, ns means no significance. Error bars represent as the mean ± SD.
- Purified GST‐ORF6 was incubated with His‐DGAT1 or His‐DGAT2, and analysis the interactions by GST pull‐down.
- HeLa cells stable expressing vector or ORF6‐Flag were treated or untreated with 50 μM ATGL inhibitor, along with DMSO or 1 μM DGAT1 inhibitor (DGAT1i) or/and 2 μM DGAT2 inhibitor (DGAT2i) for 24 h. LDs were labeled with BODIPY‐493/503 (green). Cells were imaged by confocal microscopy. Scale bar represents 10 μm.
- Mean number of LDs in each cell in (H) was counted from 35 cells of three independent experiments. Two‐tailed Unpaired Student's t‐test, ***P < 0.001, ****P < 0.0001, ns means no significance. Error bars represent the mean ± SD.
- SARS‐CoV‐2‐infected Vero‐E6 cells were treated with 1 μM DGAT1 inhibitor or/and 2 μM DGAT2 inhibitor for 24 h. Cell viability was analyzed. Cell lysates were analyzed via WB. Supernatants were determined by plaque assays. Virus titer values represent mean ± SD for three independent experiments. Two‐tailed Unpaired Student's t‐test, ***P < 0.001, ns means no significance. Error bars represent the mean ± SD.
Source data are available online for this figure.
