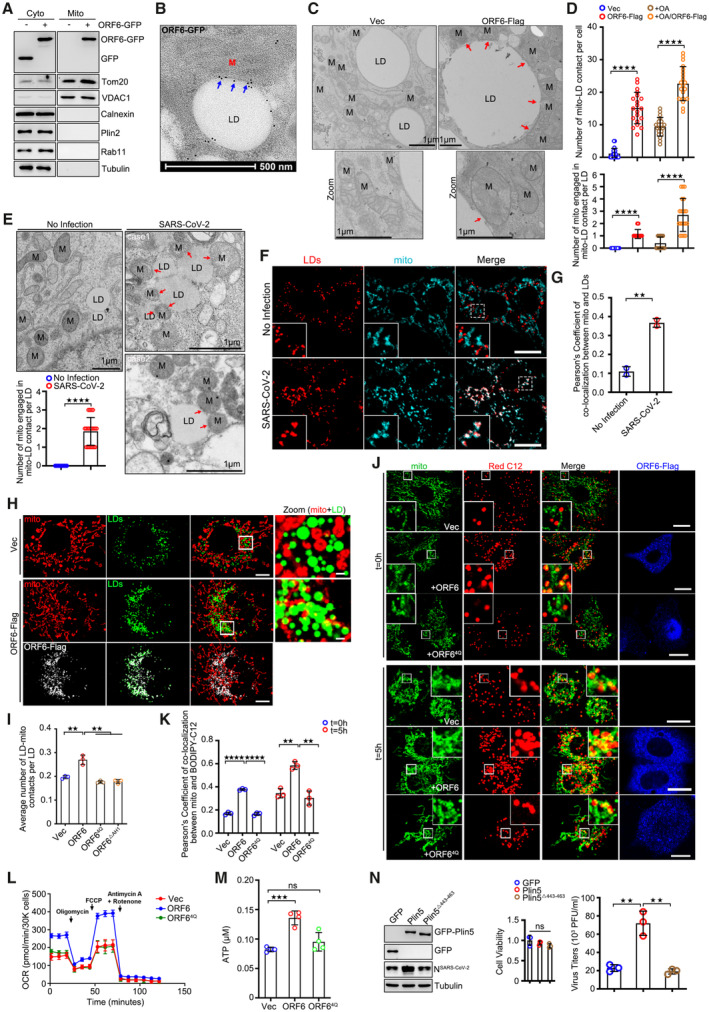
Figure 6. ORF6 links LDs to mitochondria.

-
ASubcellular fractions were isolated from GFP or ORF6‐GFP over‐expressed cells. Tom20 and VDAC1 represent mitochondria markers, Calnexin represents the ER, Plin2 represents LDs, Rab11 represents endosomes, and Tubulin represents cytoplasm, respectively.
-
BRepresentative immunogold electron micrograph of ORF6‐GFP transfected HeLa cell showing ORF6‐GFP dots (blue arrows) are enriched at mitochondria‐LD contact sites. M, mitochondria. LD, lipid droplets. Scale bar represents 500 nm.
-
CRepresentative transmission electron micrograph of ORF6‐Flag stable expressing or vector HeLa cells upon OA treatment. Red arrows mark the contact sites between LDs and mitochondria. M, mitochondria. LD, lipid droplets. Scale bar represents 1 μm.
-
DThe number of mitochondria‐LD contacts per cell in (C and Fig EV5C) was counted from 20 cells. The number of mitochondrial engaged in mitochondrial‐LD contact per LD in (C) was counted from 20 LDs. Two independent experiments. Two‐tailed Unpaired Student's t‐test, ****P < 0.0001. Error bars represent the mean ± SD.
-
ERepresentative transmission electron micrograph of non‐infected or SARS‐CoV‐2 infected Vero‐E6 cells. Red arrows mark the mitochondria‐LD contact. LD, lipid droplets. M, mitochondria. Scale bar represents 1 μm. Quantification of number of mitochondria engaged in mitochondria‐LD contact per LD. 20 LDs of two independent experiments were counted. Two‐tailed Unpaired Student's t‐test, ****P < 0.0001. Error bars represent the mean ± SD.
-
F, GSARS‐CoV‐2‐infected Vero‐E6 cells were fixed and stained with anti‐Tom20 (cyan). Tom20 represents mitochondria marker. LDs were labeled with LipidTOX Deep Red (red). Cells were imaged by confocal microscopy. Scale bar represents 10 μm. Colocalization of LDs and mitochondria (Pearson's Coefficient), n = 20 cells, two independent experiments. Two‐tailed Unpaired Student's t‐test, **P < 0.01. Error bars represent the mean ± SD.
-
HCos7 cells expressing ORF6‐Flag and vector were treated with 200 μM OA for 12 h, and then were fixed and stained with anti‐Flag (white) and anti‐Tom20 (red). Tom20 represents mitochondria marker. LDs were labeled with BODIPY‐493/503 (green). Cells were imaged by confocal microscopy. Scale bar represents 10 μm.
-
IQuantification of average number of LD‐mitochondria contacts per LD from (H and Fig EV5D). 37 cells (Vector), 50 cells (ORF6), 50 cells (ORF64Q), and 50 cells (ORF6▵AH1) from three independent experiments were calculated. Two‐tailed Unpaired Student's t‐test, **P < 0.01. Error bars represent the mean ± SD.
-
JPulse‐chase assays of vector or ORF6‐Flag or ORF64Q‐Flag stable cells with or without starvation treatment. HeLa cells were incubated in complete medium containing 1 μM BODIPY 558/568 C12 (red) for 16 h. Cells were washed with PBS three times and then chased or non‐chased in EBSS for 5 h, and then were fixed and stained with anti‐Flag (blue) and anti‐Tom20 (green). Tom20 represents mitochondria marker. Cells were imaged by confocal microscopy. Scale bar represents 10 μm.
-
KColocalization of BODIPY‐C12 and mitochondria (Pearson's Coefficient), n = 20 cells, three independent experiments. Two‐tailed Unpaired Student's t‐test, **P < 0.01, ****P < 0.0001. Error bars represent the mean ± SD.
-
LSeahorse FAO assays to examine the oxidation of endogenous FAs in vector, or ORF6‐Flag or ORF64Q‐Flag over‐expressed HeLa cells. Three biological replicates were performed with similar results. Error bars represent the mean ± SD.
-
MThe concentration of ATP in cells was analyzed according to manufacturer's instructions. Error bars, mean ± SD of four independent experiments. Two‐tailed Unpaired Student's t‐test, ***P < 0.001, ns means no significance.
-
NVero‐E6 cells stable expressing GFP or GFP‐Plin5 or GFP‐Plin5Δ443–463 were infected with SARS‐CoV‐2 for 24 h. Cell viability was analyzed. Cell lysates were analyzed via WB. Supernatants were determined by plaque assays. Virus titer values represent mean ± SD for three independent replicates. Two‐tailed Unpaired Student's t‐test, **P < 0.01, ns means no significance. Error bars represent the mean ± SD.
Source data are available online for this figure.
