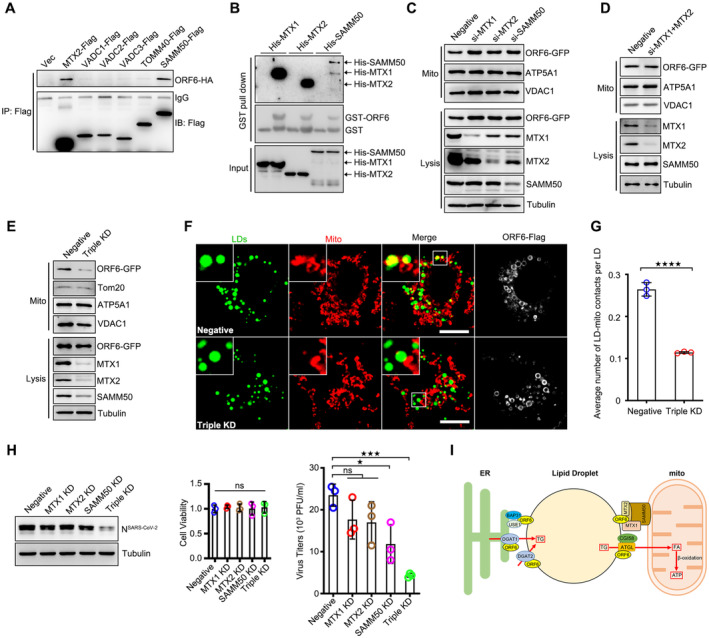
Figure 7. ORF6 interacts with SAM complex.

- The Flag tagged mitochondrial outer membrane proteins were co‐expressed in HEK293T cells with ORF6‐HA. Protein interactions were analyzed by immunoprecipitation with anti‐Flag beads and immunoblotting analysis.
- Purified GST protein or GST‐ORF6 were incubated with purified His tagged MTX1, MTX2, or SAMM50, and analyzed the interactions by GST pull‐down.
- HeLa cells were transfected with negative, or si‐MTX1, or si‐MTX2, or si‐SAMM50 for 24 h and further transfected with ORF6‐GFP 24 h. Subcellular fractions were isolated from cells. VDAC1 and ATP5A1 represent mitochondria markers, Tubulin represents cytosolic marker.
- HeLa cells were transfected with negative or si‐MTX1 and si‐MTX2 for 24 h and further transfected with ORF6‐GFP 24 h. Subcellular fractions were isolated from cells. VDAC1 and ATP5A1 represent mitochondria markers, Tubulin represents cytosolic marker.
- HeLa cells were transfected with negative or si‐MTX1/si‐MTX2/si‐SAMM50 (Triple KD) for 24 h and further transfected with ORF6‐GFP 24 h. Subcellular fractions were isolated from cells. VDAC1 and ATP5A1 represent mitochondria markers, Tubulin represents cytosolic marker.
- Cos7 cells expressing ORF6‐Flag were transfected with negative or si‐MTX1/si‐MTX2/si‐SAMM50 (Triple KD) for 36 h and treated with 200 μM OA for another 12 h. Cells were fixed and stained with anti‐Flag (white) and anti‐Tom20 (red). Tom20 represents mitochondria marker. LDs were labeled with BODIPY‐493/503 (green). Cells were imaged by confocal microscopy. Scale bar represents 10 μm.
- Quantification of average number of LD‐mitochondria contacts per LD from (F). 25 cells (Negative), 50 cells (Triple KD) from three independent experiments were calculated. Two‐tailed Unpaired Student's t‐test, ****P < 0.0001. Error bars represent the mean ± SD.
- Vero‐E6 cells were transfected with indicated siRNAs for 24 h and infected with SARS‐CoV‐2 for 24 h. Cell viability was analyzed. Cell lysates were analyzed via WB. Supernatants were determined by plaque assays. Virus titer values represent mean ± SD for three independent replicates. Two‐tailed Unpaired Student's t‐test, *P < 0.05, ***P < 0.001, ns means no significance. Error bars represent the mean ± SD.
- Proposed model for the role of SARS‐CoV‐2 ORF6 links LDs, the ER, and mitochondria, and modulates lipogenesis and lipolysis to facilitate viral production.
Source data are available online for this figure.
