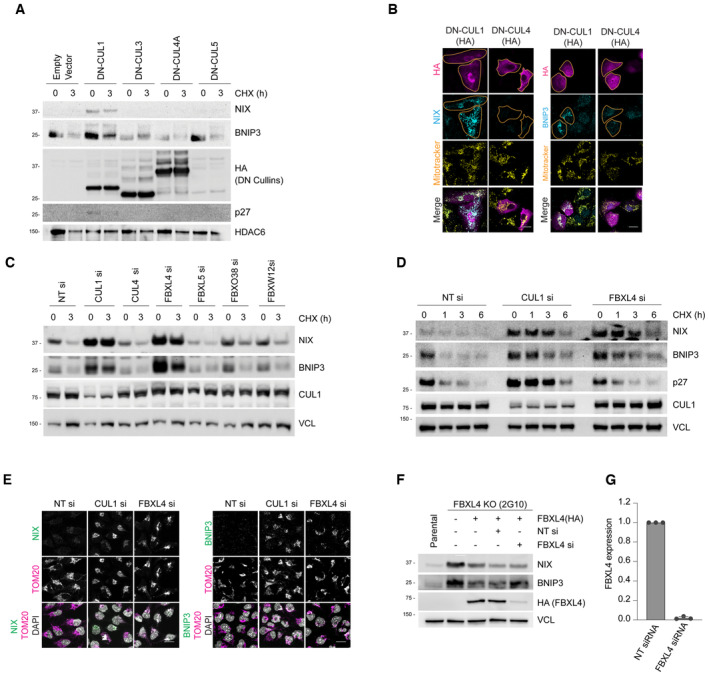
Figure EV1. Identification of SCF‐FBXL4 as a negative regulator of NIX and BNIP3 stability.

- Expression of dominant‐negative (DN) Cullin 1 results in an increase in the levels and half‐life of NIX and BNIP3. HeLa‐T‐REx‐Flp‐in cells were transfected with FLAG‐HA‐tagged dominant‐negative CUL1, CUL3, CUL4A and CUL5 or an empty vector. Cells were treated with cycloheximide for 3 h followed by immunoblotting with the indicated antibodies.
- Expression of dominant‐negative (DN) Cullin 1 results in the accumulation of NIX and BNIP3 at mitochondria. U2OS cells were transfected with FLAG‐HA‐tagged DN‐CUL1 or FLAG‐HA‐tagged DN‐CUL4 and immunostained for both HA and either NIX or BNIP3. An orange line marks the edge of the individual cells expressing the dominant‐negative cullin protein.
- Screen for F‐box proteins required for turnover of NIX and BNIP3. U2OS cells were transfected with the indicated siRNAs. Total‐cell lysates were subject to immunoblotting as shown. NIX and BNIP3 are stabilised by depletion of CUL1 and FBXL4 (but not other F‐box proteins). NT = non‐targeting.
- NIX and BNIP3 are upregulated and stabilised by depletion of FBXL4 and CUL1. U2OS cells were transfected with non‐targeting siRNA, CUL1 siRNA or FBXL4 siRNA. Cells were treated with cycloheximide for the indicated times prior to immunoblotting with the specified antibodies.
- Depletion of FBXL4 and CUL1 results in NIX and BNIP3 accumulation at mitochondria. U2OS cells were transfected with non‐targeting siRNA, CUL1 siRNA or FBXL4 siRNA. Cells were fixed and stained with the indicated antibodies.
- Evaluation of the efficacy of FBXL4 siRNA to reduce exogenous HA‐tagged FBXL4 protein levels. U2OS FBXL4 knockout cells (which are described in Fig 2 and Table EV1) constitutively expressing FBXL4‐HA (FBXL4 tagged with C‐terminal HA) were transfected with non‐targeting siRNA or FBXL4 siRNA. Immunoblotting was performed as indicated.
- U2OS cells were transfected with non‐targeting siRNA or FBXL4 siRNA and the efficiency of FBXL4 siRNA was evaluated using quantitative‐PCR. Bars represent the mean ± SD from three independent transfections.
Data information: Scale bars = 20 μm.
