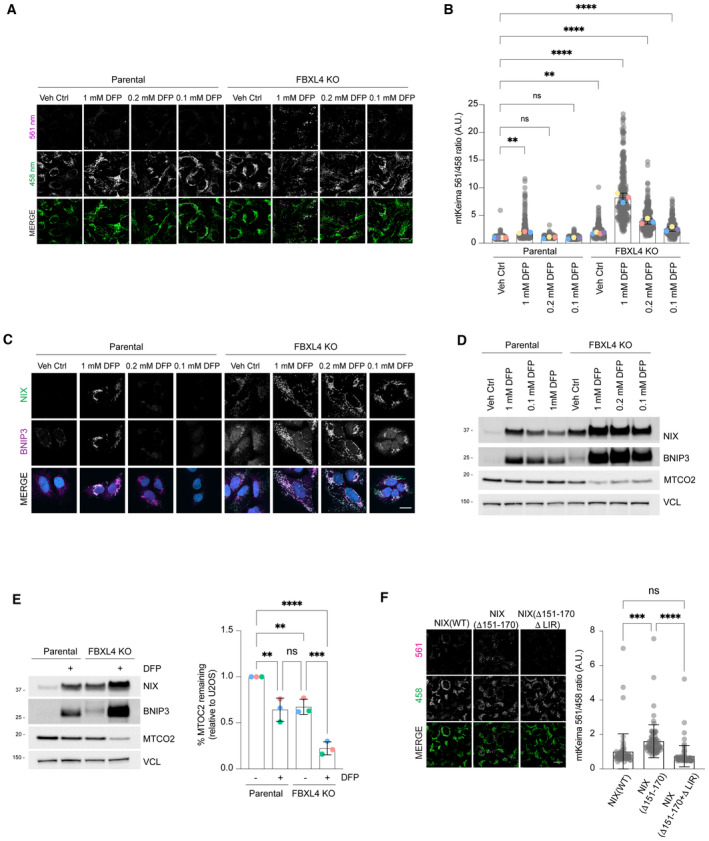
Figure EV3. FBXL4 deficiency promotes mitophagy through NIX/BNIP3 stabilisation.

- FBXL4‐deficient cells are ultra‐sensitive to DFP‐induced mitophagy. U2OS mt‐Keima cells and U2OS mt‐Keima FBXL4 KO cells were treated with DFP at specified concentrations for 24 h and analysed by live‐cell confocal microscopy. The emission signals obtained after excitation with the 458 nm laser (neutral pH) or 561 nm laser (acidic pH) are shown in green and magenta respectively.
- Quantification of mitophagy shown in panel (A). Mitophagy is represented as the ratio of mt‐Keima 561 nm fluorescence intensity divided by mt‐Keima 458 nm fluorescence intensity for individual cells normalised to the parental condition.
- Corresponding conditions from (A, B) were harvested for immunoblotting to analyse levels of NIX and BNIP.
- Analysis of NIX and BNIP localisation in parental cells or FBXL4 KO cells treated with specified concentration of DFP.
- Quantification of the MT‐CO2 protein levels in parental or FBXL4 KO cells treated with DFP. Western blotting was used to assess MT‐CO2 levels remaining relative to parental untreated cells.
- Mitophagy induced by hyper‐stable NIX (Δ151‐170) requires NIX's LC3 interaction domain. Hela Flp‐in Keima cells stably expressing inducible NIX(WT), NIX(Δ151‐170) or NIX (151–170, LIRmut) were treated with doxycycline for 48 h. Mitophagy was quantified as in (B).
Data information: In (B and F), translucent grey dots represent measurements from individual cells. In (B), coloured circles represent the mean ratio from independent experiments (N = 4 for Veh Ctrl conditions and N = 3 for other conditions) and the centre lines and bars represent the mean of the independent replicate means ± SD. In (E), the coloured circles represent the = densitometry values of MT‐CO2 normalised to VCL loading control from independent experiments. In (F), the centre lines and bars represent the mean of the individual cells ± SD (N = 1, > 60 cells analysed). For (B), P values were calculated from the mean values from independent experiments using one‐way ANOVA; for (F), P values were calculated from the ratios of the individual cells (*P < 0.05, **P < 0.005, ***P < 0.001, ****P < 0.0001). Scale bars = 20 μm.
Source data are available online for this figure.
