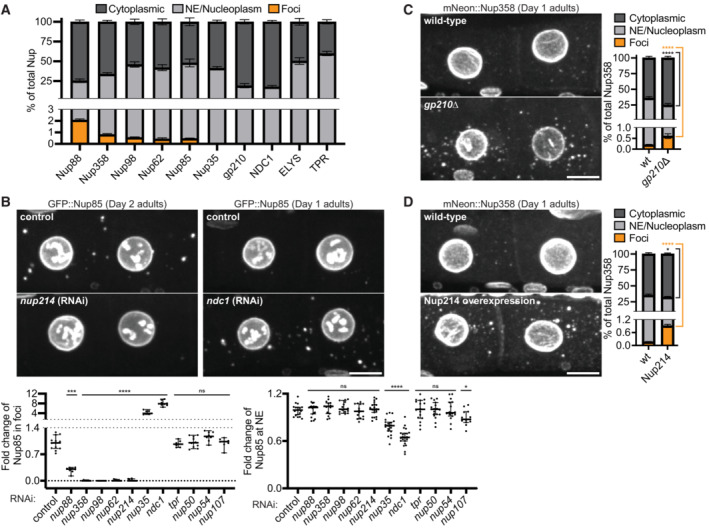
Figure 3. Nup foci are condensates scaffolded by cytoplasmic facing FG‐Nups.

- Quantification of the distribution of CRISPR‐tagged Nups between the cytoplasm (soluble), nuclear envelope (NE)/nucleoplasm, and cytoplasmic foci (see Materials and Methods). Measurements were made using the ‐3 and ‐4 oocytes of Day 2 adults. Error bars represent 95% CI for n > 5 germlines (biological replicates).
- Top: Representative confocal micrographs showing ‐3 and ‐4 oocytes of Day 1 or Day 2 adults with CRISPR‐tagged GFP::Nup85. nup214 RNAi is representative of a treatment that largely abolishes Nup foci, whereas ndc1 RNAi enhanced Nup foci. Left graph: Quantification of the total percent of GFP::Nup85 in foci following each RNAi treatment. Values are normalized so that the average control measurement = 1.0. Error bars represent 95% CI for n > 7 germlines (biological replicates). Right graph: Line‐scan quantification measuring GFP::Nup85 signal at the NE following each RNAi treatment. Values are normalized so that the average control measurement = 1.0. Error bars represent 95% CI for n > 13 nuclei (biological replicates).
- Left: Representative confocal micrographs showing CRISPR‐tagged mNeonGreen::Nup358 in ‐3 and ‐4 oocytes of Day 1 wild‐type versus gp210∆ adults. Right: Quantification of the distribution of mNeonGreen::Nup358 between the cytoplasm, NE/nucleoplasm, and cytoplasmic foci in wild‐type versus gp210∆ oocytes. Error bars represent 95% CI for n > 6 germlines (biological replicates).
- Left: Representative confocal micrographs showing mNeonGreen::Nup358 in ‐3 and ‐4 oocytes of Day 1 adults with or without overexpression of Nup214::wrmScarlet. Right: Quantification of the distribution of mNeonGreen::Nup358 between the cytoplasm, NE/nucleoplasm, and cytoplasmic foci in wild‐type oocytes versus those with Nup214 overexpression. Error bars represent 95% CI for n > 9 germlines (biological replicates).
Data information: ****P < 0.0001; ***P < 0.001; *P < 0.05; ns, not significant. For panel B significance was determined using a one‐way ANOVA; for all other panels significance was determined using an unpaired t‐test. All images in this figure are maximum intensity projections. Scale bars = 10 μm.
Source data are available online for this figure.
