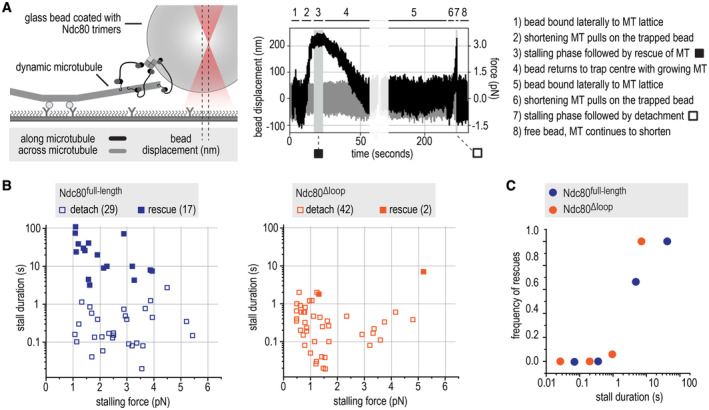
Figure 3. The loop stabilizes end‐on Ndc80‐microtubule interactions under force.

- Schematic of the optical trap experiment and a typical force trace. A glass bead coated with full‐length or loopless Ndc80 trimers is held in an optical trap near a microtubule end. The displacement of the bead (left Y axis) and the corresponding force (right Y axis) are shown along and across the microtubules axis (black and gray, respectively). Typical stages of an experiment (steps 1–8) are described.
- Correlations of stall duration and stall force. Each datapoint represents a single stall event. Filled squares: stalls resulting in microtubule rescue. Open squares: stalls resulting in bead detachment from the microtubule.
- The frequency of rescue events after a stall is plotted for full‐length (n = 46) and loopless (n = 44) Ndc80 after binning based on stall duration.
Source data are available online for this figure.
