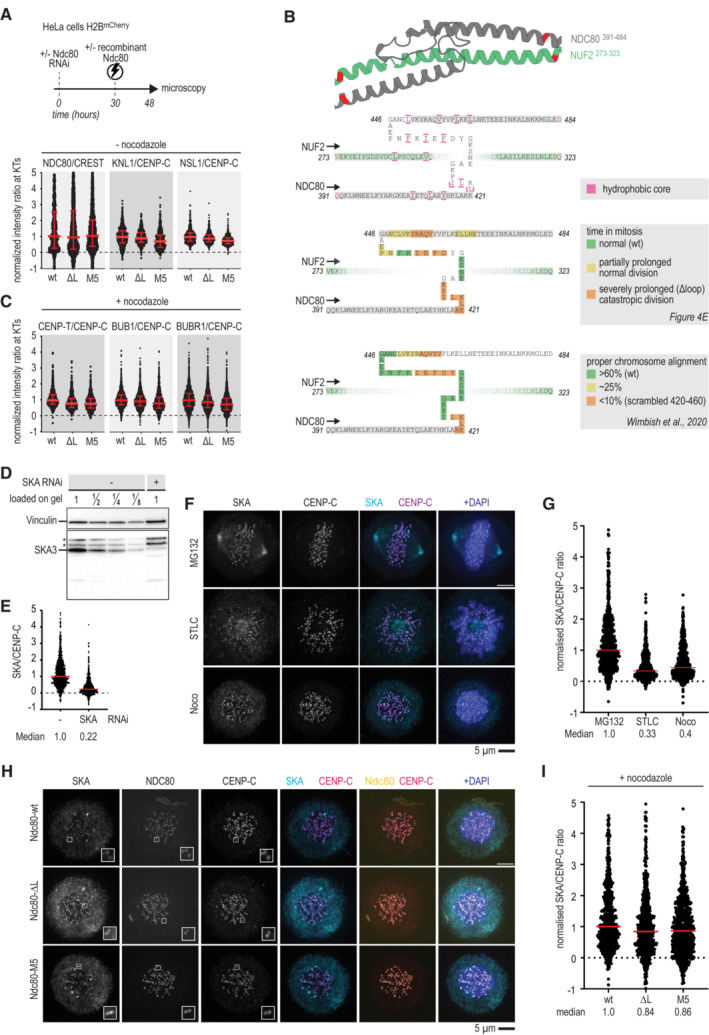
Figure EV3. Electroporation efficiency and a comparison of loop mutants.

-
AImmunofluorescence quantification of Ndc80, KNL1, and NSL1 at kinetochores following electroporation of different Ndc80 constructs. The number of kinetochores analyzed for NDC80: wt ‐ 758, ∆L ‐ 2,053, M5 ‐ 1,612, KNL1: wt ‐ 697, ∆L ‐ 635, M5 ‐ 602, and NSL1: wt ‐ 647, ∆L ‐ 644, M5 ‐ 611. Red lines indicate median value with interquartile range.
- B
-
CImmunofluorescence quantification of various kinetochore proteins in cells that were treated as described in panel (A), but with nocodazole added 15 h after electroporation and 3 h before fixation. The number of kinetochores analyzed for CENP‐T: wt ‐ 799, ∆L ‐ 750, M5 ‐ 855, BUB1: wt ‐ 2,226, ∆L ‐ 1,993, M5 ‐ 1,598, and BUBR1: wt ‐ 2,315, ∆L ‐ 2,112, M5 ‐ 1,549. Red lines indicate median value with interquartile range.
-
DA new anti‐SKA antibody, generated against the full‐length recombinant SKA complex, mainly recognizes SKA3 in a HeLa cell lysate using immunoblotting. Asterisks indicate non‐specific bands that are not sensitive to depletion of the SKA complex by RNAi.
-
E–GThe antibody also recognizes SKA by immunofluorescence. SKA levels are higher in MG132 arrested cells than in STLC or nocodazole arrested cells. Scale bar: 5 μm.
-
H, ISKA levels recruited to kinetochores in nocodazole‐exposed cells with various Ndc80 complexes. Scale bar: 5 μm.
Source data are available online for this figure.
