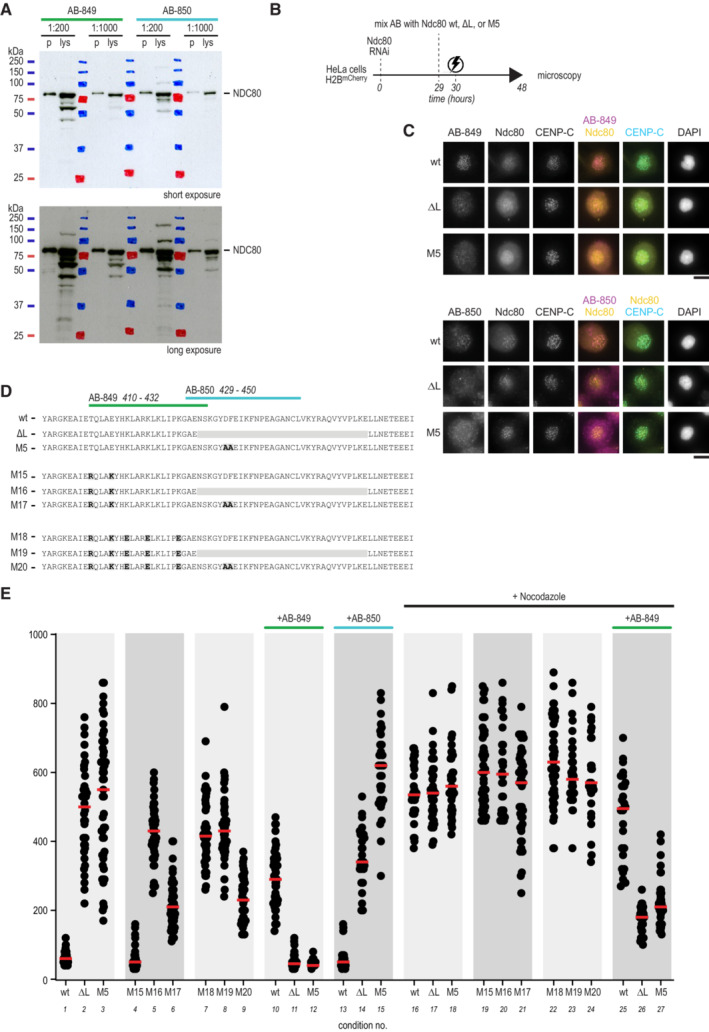
Figure EV5. Characterization of AB‐849 and AB‐850 in vitro .

- AB‐849 and AB‐850 recognize NDC80 in a HeLa cell lysate (lys) using immunoblotting. Recombinant Ndc80 complex (p) was used as a reference (see Fig 6A) Antibody dilutions are indicated and short (top panel) and long (bottom panel) exposures are shown.
- Experimental workflow to electroporate Ndc80 complexes with AB‐849 or AB‐850 into cells.
- The localization of AB‐849, AB‐850, NDC80, CENP‐C, and DNA was analyzed using immunofluorescence microscopy. Representative cells are shown. Scale bar: 10 μm.
- Overview of mutants M15–M20, mutated in the epitope region of AB‐849 to further test putative effects of the AB on the SAC.
- Time spent in mitosis in the presence or absence of nocodazole. Cells were electroporated with various Ndc80 constructs, when indicated following mixture with AB‐849 or AB‐850. Every dot represents a cell and red lines indicate median values. Effects of AB‐849 on the time spent in mitosis were not recapitulated by any of the mutants M15–M20.
Source data are available online for this figure.
