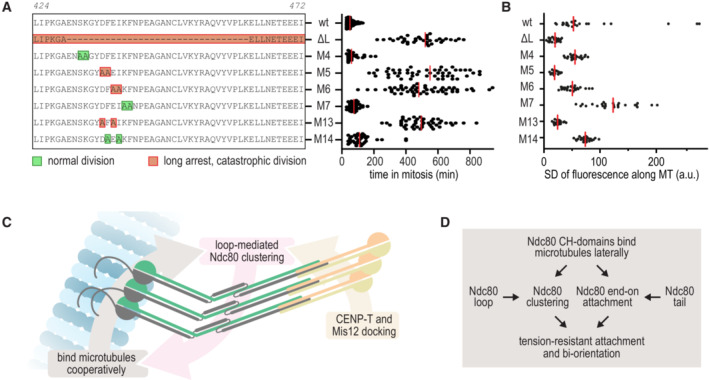
Figure 8. NDC80 D436 and E438 promote Ndc80 clustering on microtubules and chromosome congression.

- Effects of M13 and M14 on the time spent in mitosis following the experimental setup outlined in Fig 4. All other datapoints are also shown in Fig 4E. Colors indicate whether cells divided normally, sometimes with delayed chromosome congression (green), or showed long arrests followed by a catastrophic division (orange). Each dot represents a cell and the red lines indicate median values. A minimum of 30 cells were analyzed for each condition.
- A model for the synergistic contributions of the Ndc80 loop and the Ndc80 tail to robust kinetochore‐microtubule attachments.
- A schematic representation of loop‐mediated interactions that stabilize Ndc80‐Ndc80 interactions when Ndc80 complexes align following their anchoring on multivalent receptors at both ends.
Source data are available online for this figure.
