
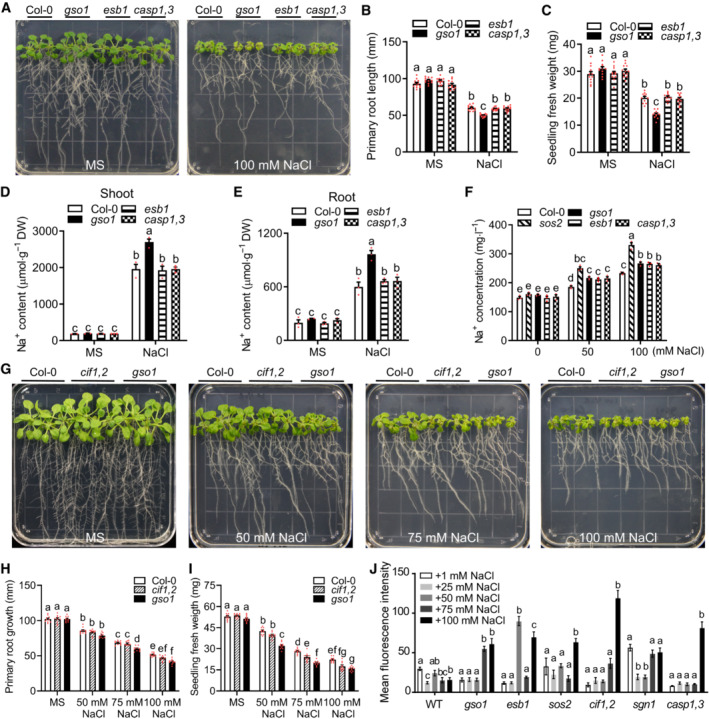
Figure 5. GSO1 dually functions in Casparian strip development and salt stress tolerance/SOS pathway activation.
-
APhenotypes of WT (Col‐0), gso1‐3, esb1, and casp1 casp3. Seedlings were grown on 1/2 MS for 6 days and then transferred to 1/2 MS medium with or without 100 mM NaCl for 10 days.
-
B, CPrimary root length and seedling fresh weight of seedlings depicted in (A) were measured at day 10 after transfer (mean ± SEM, n = 12, two‐way ANOVA, P < 0.05).
-
D, ENa+ content in roots and shoots of the indicated genotypes. Seedlings were grown on 1/2 MS medium for 6 days and then transferred to 1/2 MS medium with or without 100 mM NaCl for 8 days (DW: dry weight, mean ± SEM, n = 3, P < 0.05, two‐way ANOVA).
-
FNa+ content of xylem sap of indicated genotypes. Seedlings were grown in soil for 2 weeks and then treated with 1/2 MS medium or 1/2 MS medium supplemented with NaCl for 1 day (mean ± SEM, n = 3, P < 0.05, two‐way ANOVA).
-
GPhenotypes of WT (Col‐0), cif1 cif2, and gso1‐3. Seedlings were grown on 1/2 MS medium for 6 days and then transferred to 1/2 MS medium supplemented with or without 100 mM NaCl for 10 days.
-
H, IPrimary root length and seedling fresh weight of seedlings depicted in (A) were measured at day 10 after transfer (mean ± SEM, n = 10, P < 0.05, two‐way ANOVA).
-
JQuantification of Fluorol Yellow fluorescence intensity indicating amounts of suberin accumulation in maximum projections of z‐stacks in the first mm of the continuously suberized endodermis in the indicated genotypes. Seedlings were grown on 1/2 MS for 5 days and then treated with the indicated NaCl concentrations for 2 days (mean ± SEM, n = 3–5, P < 0.05, one‐way ANOVA and post hoc Tukey Kramer test, different letters indicate significant difference).
Source data are available online for this figure.