Figure 3:

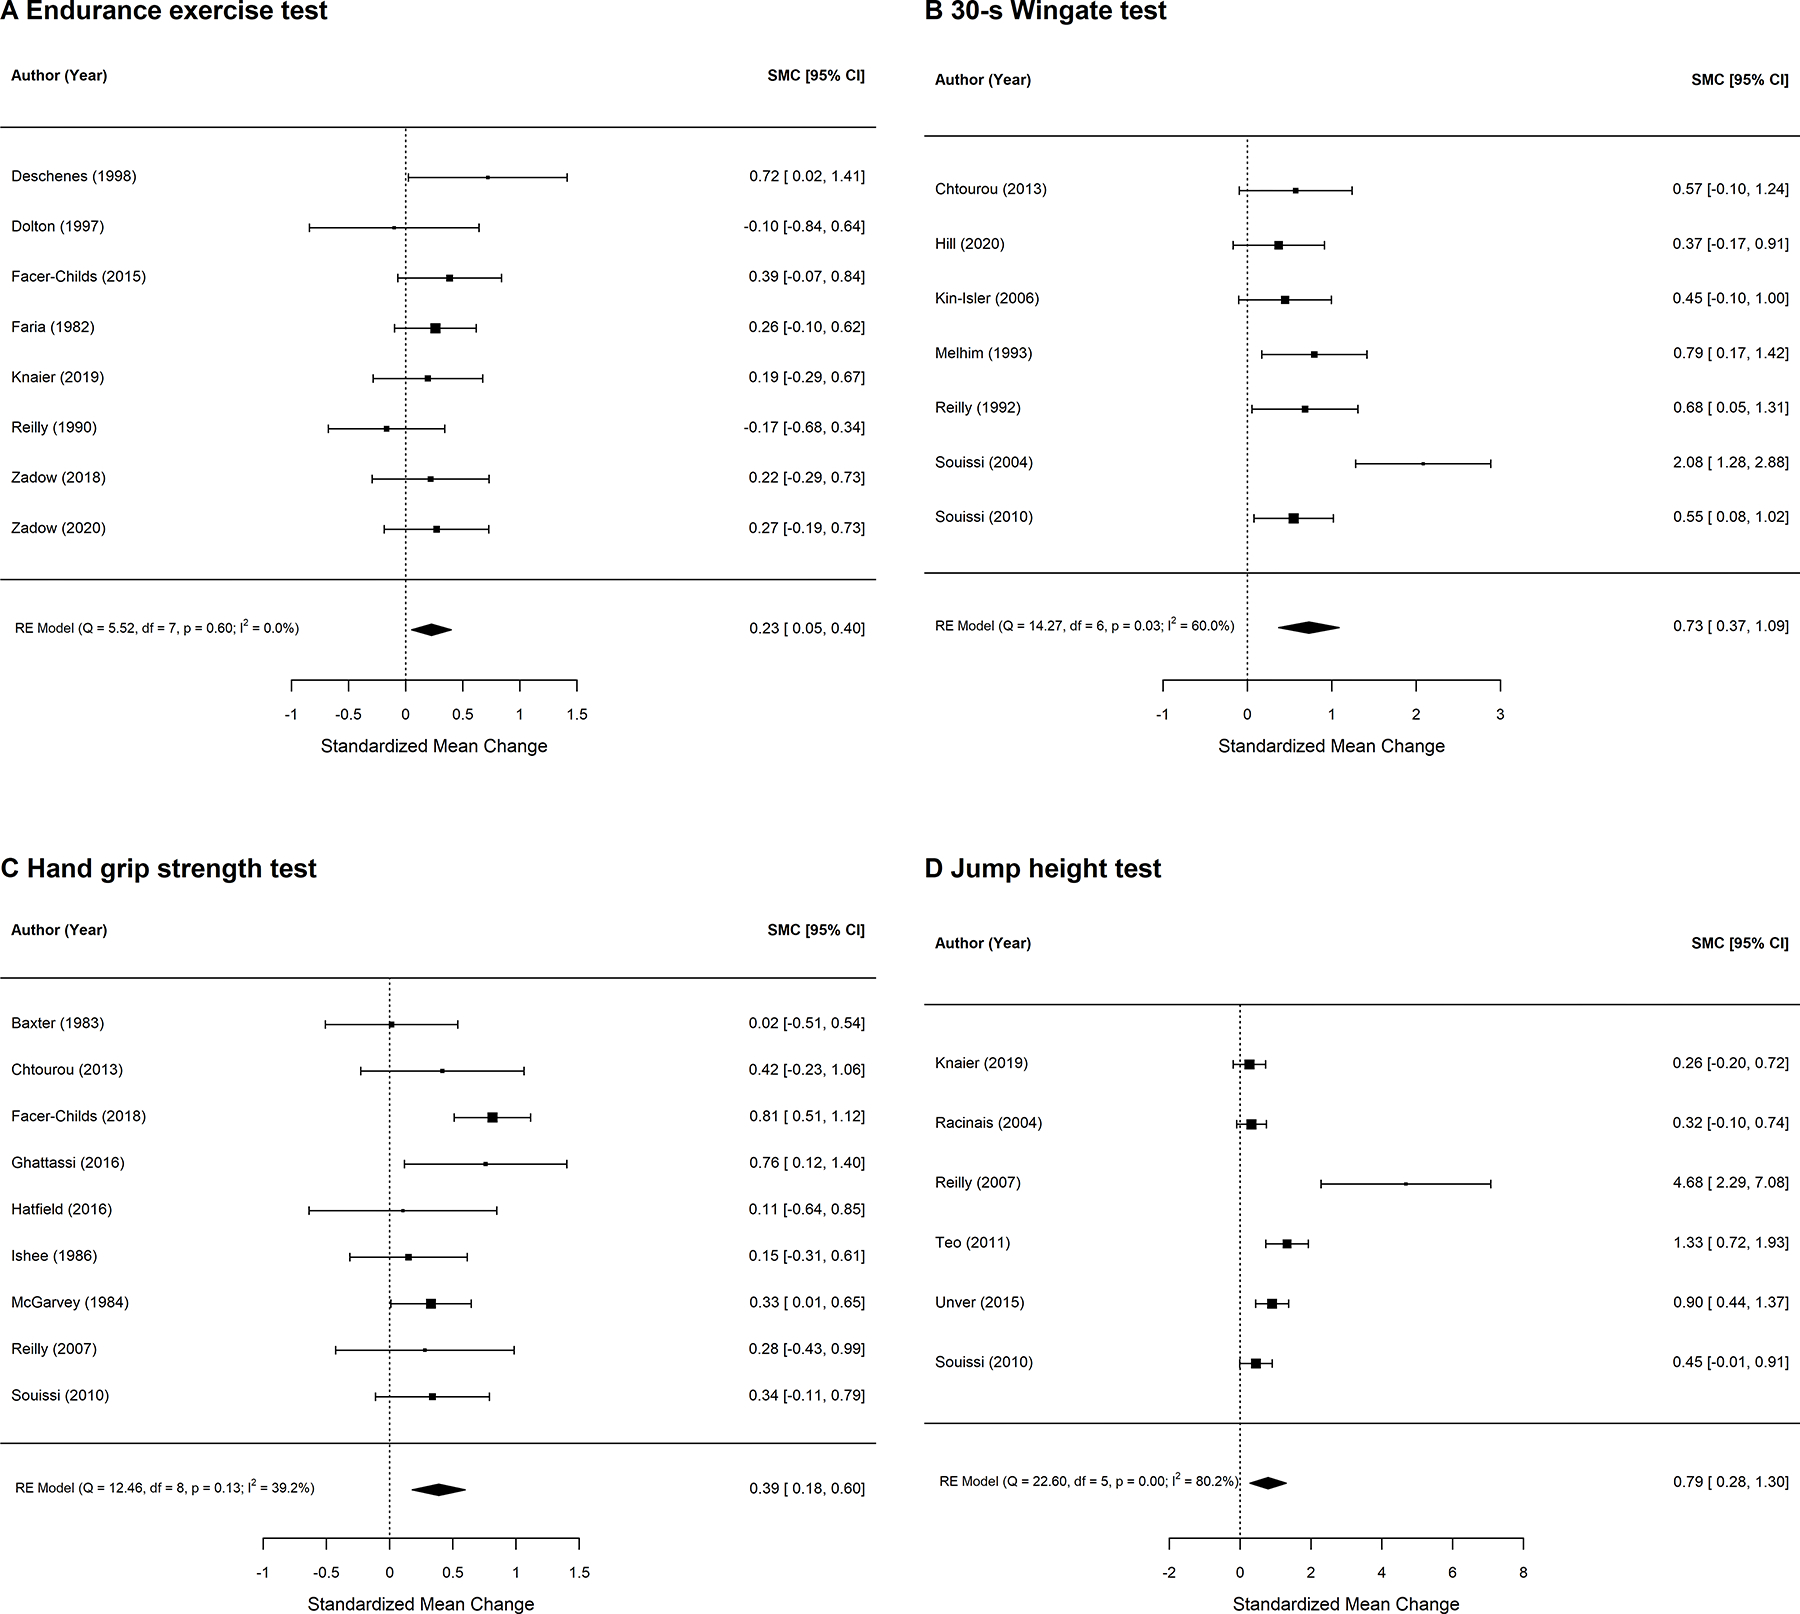
Forest plot for standardized mean change for A: Endurance exercise tests; B: 30-s Wingate test; C: handgrip strength test; D: jump height. Effects are calculated on an assumed correlation between within-participant measurements of r=0.8.

Forest plot for standardized mean change for A: Endurance exercise tests; B: 30-s Wingate test; C: handgrip strength test; D: jump height. Effects are calculated on an assumed correlation between within-participant measurements of r=0.8.