Fig. 2.
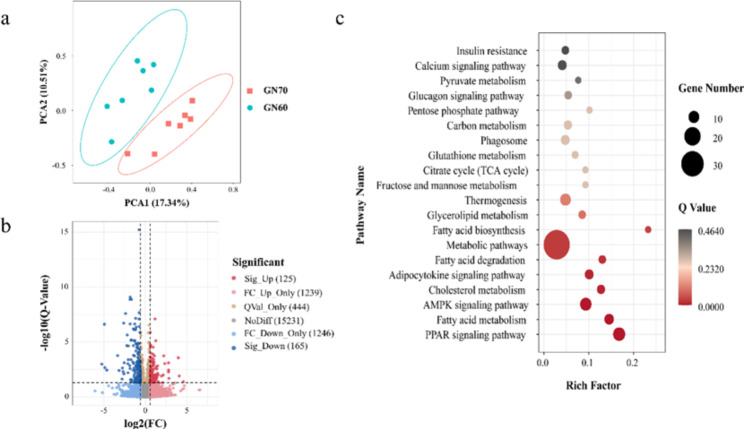
Transcriptomic differences between GN60 and GN70. a Principal component analysis of the total detected genes fed GN60 and GN70 diets. The X and Y-axis represent the first two principal components. The percentage value in the bracket represents the percentage of variance explained by that principal component. b Volcano Plot of up- and down- regulated DEGs between GN60 and GN70 group. Sig_Up: significantly up-regulated; FC_Up_Only: The difference is up-regulated, but the p value is not significantly different; QVal_Only: significant difference in Q value, but insignificant difference multiple; NoDiff: No difference; FC_Down_Only: The difference is down, but the Q value is not significantly different; Sig_Down: significant difference down. c KEGG pathway enrichment highlights the markedly altered lipid metabolism correlation pathway. Circle size indicates the number of DEGs enriched in the pathway, and circle colour indicates the degree of enrichment

