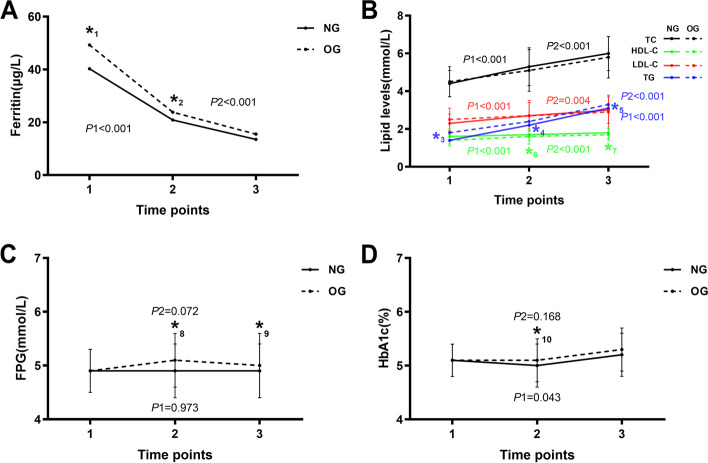
Fig. 1.
Level changes of a ferritin, b lipid, c FPG and d HbAlc across pregnancy in women with GDM. NG: Normal Group; OG: Overweight/obese Group; TC: total cholesterol; HDL-C: high-density lipoprotein cholesterol; LDL-C: low-density lipoprotein cholesterol; TG: triglyceride; FPG: fasting plasma glucose. 1: The 1st trimester; 2: The 2nd trimester; 3: The 3rd trimester. *: There was a statistical difference between the two groups at this time point. P values: *1: 0.013; *2:0.042; *3:0.021; *4:0.047; *5: 0.035; *6: 0.030; *7: 0.034; *8: 0.019; *9: 0.044; *10: 0.038. P1: P for trend in NG. P2: P for trend in OG

