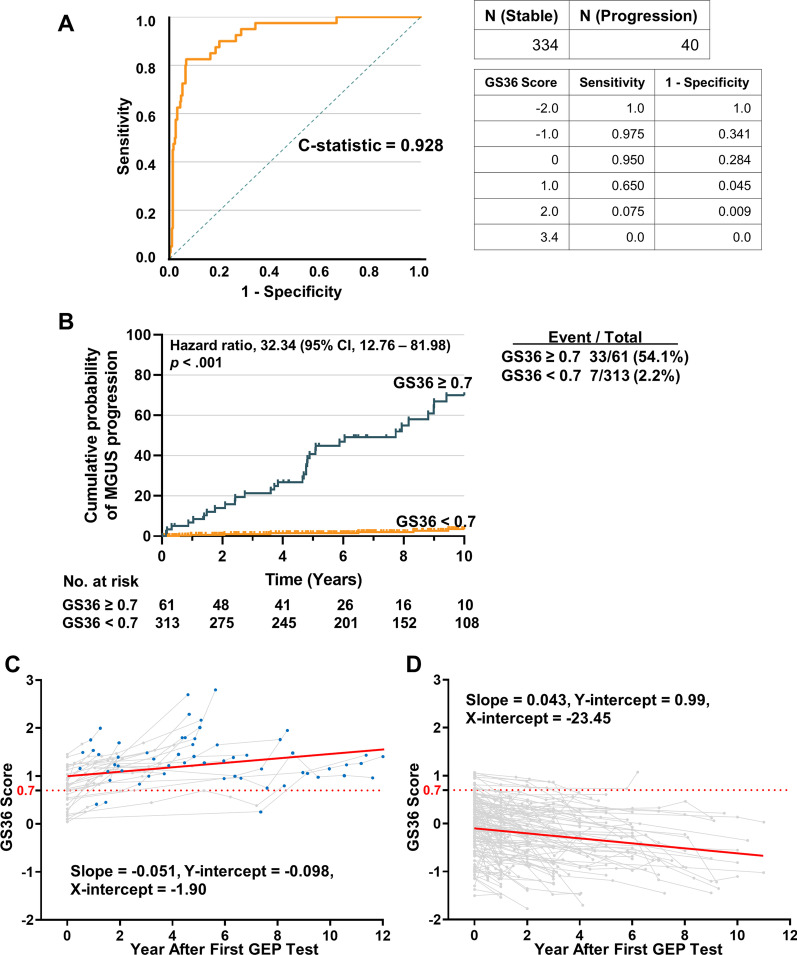
Fig. 1.
GS36 predicted MGUS progression. (A) MGUS Time-to-progression Curves in the GS36. Receiver operating characteristic curve (ROC) based on GS36. The C-statistic of ROC is 0.928. (B) Time-to-progression curve based on GS36. Among 40 patients who developed MM in 10 years, 33 patients had a GS36 ≥ 0.7 or test positive (T+), yielding a sensitivity of 82.5%. For the remaining 334 stable patients, only 28 patients had GS36 ≥ 0.7, yielding a false positive rate of 8.4% or a specificity of 91.6%. Also, 61 patients were identified to have T+ , while the remaining 313 patients tested negative (T−) or had their GS36 < 0.7. Among the 61 T+ patients, 33 patients progressed to MM in 10 years, yielding a positive predictive value (PPV) of 54.1%. For the 313 T− patients, only 7 patients developed MM in 10 years, yielding a probability of MM progression of 2.2%, or a negative predictive value (NPV) of 97.8%. (C) A total of 593 serial microarray analyses were performed on CD138-selected bone marrow samples from 174 MGUS cases with a baseline sample. The GS36 score invariably increased as the patients transitioned from MGUS into MM. (D) The GS36 score decreased in the group without progression to MM. Each grey line in the plot represents a unique patient and each point represents a unique GS36 score at that time. Blue point represents the patient at MM stage. Red line is the general trend line

