
Extended Data Fig. 3. Characterization of baseline apheresis products and preinfusion TGFβRDN expressing PSMA-directed CAR T cells (CART-PSMA-TGFβRDN).
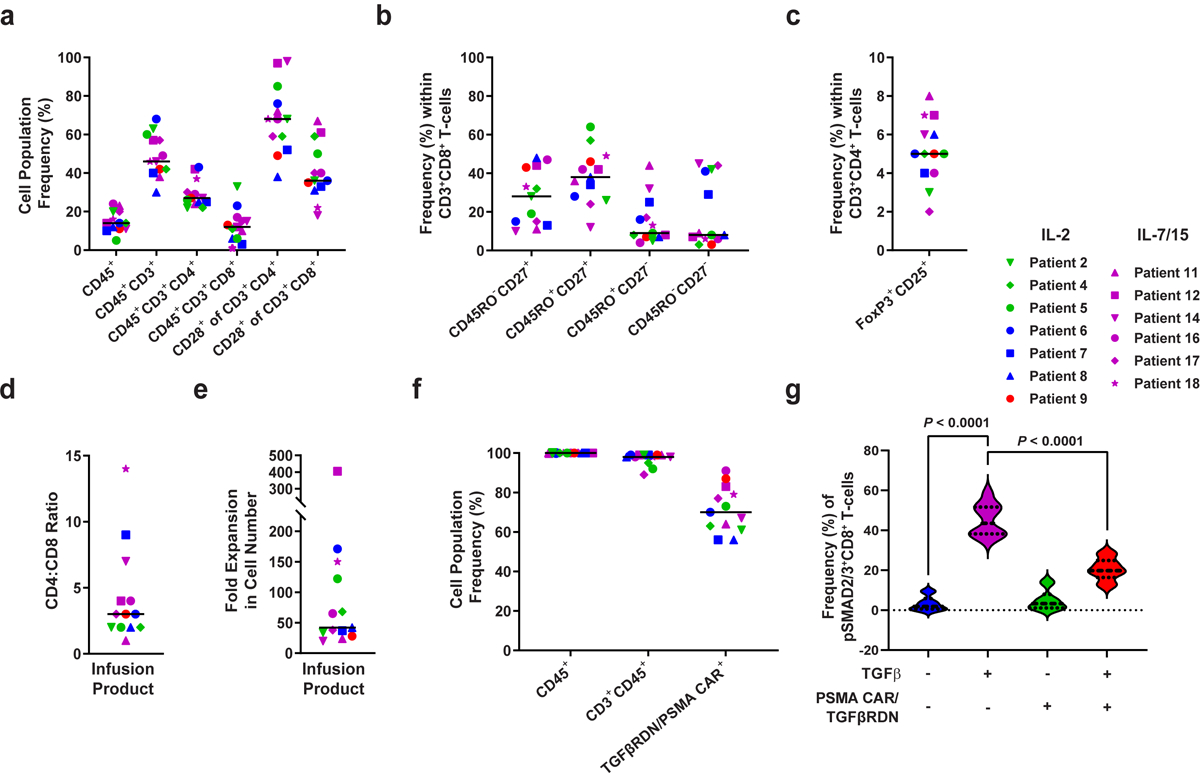
(a) Frequencies of apheresed CD45+, CD45+CD3+, CD45+CD3+CD4+, CD45+CD3+CD8+ cells and CD28+ T cells were assessed by flow cytometry. (b) Proportions of various CD3+CD8+ T cell subsets at the time of apheresis are shown: naive-like, CD27+CD45RO−; central memory, CD27+CD45RO+; effector memory, CD27−CD45RO+; effector, CD27−CD45RO−. (c) Percentages of FoxP3+CD25+ regulatory T cells in apheresis material. (d) CD4:CD8 cell ratio in the pre-infusion CAR T cell product is depicted. (e) Fold expansion of CAR T cell infusion product over 9-days of clinical manufacturing is shown. (f) Frequencies of expanded patient CD3+CD45+ T cells expressing the anti-PSMA CAR and TGFβRDN are plotted. Individual data points for each patient and means (denoted by a black horizontal line) are shown in panels a-f. (g) Expression of a TGFβRDN on manufactured PSMA-targeted CAR T cells prevents TGFβ signaling through SMAD2/3 phosphorylation. Individual data points for each patient and means are shown in all panels. IL-2 denotes patient products manufactured in the presence of this cytokine; IL-7/15 indicates CAR T cell manufacturing using these cytokines. Thick dashed lines in violin plots depict the median and thin dotted lines indicate the first and third quartiles. P values were determined with a two-tailed Student’s t-test for paired samples.