
Extended Data Fig. 4. Longitudinal cytokine, chemokine and growth factor profiles in the peripheral blood of mCRPC patients treated with CART-PSMA-TGFβRDN cells.
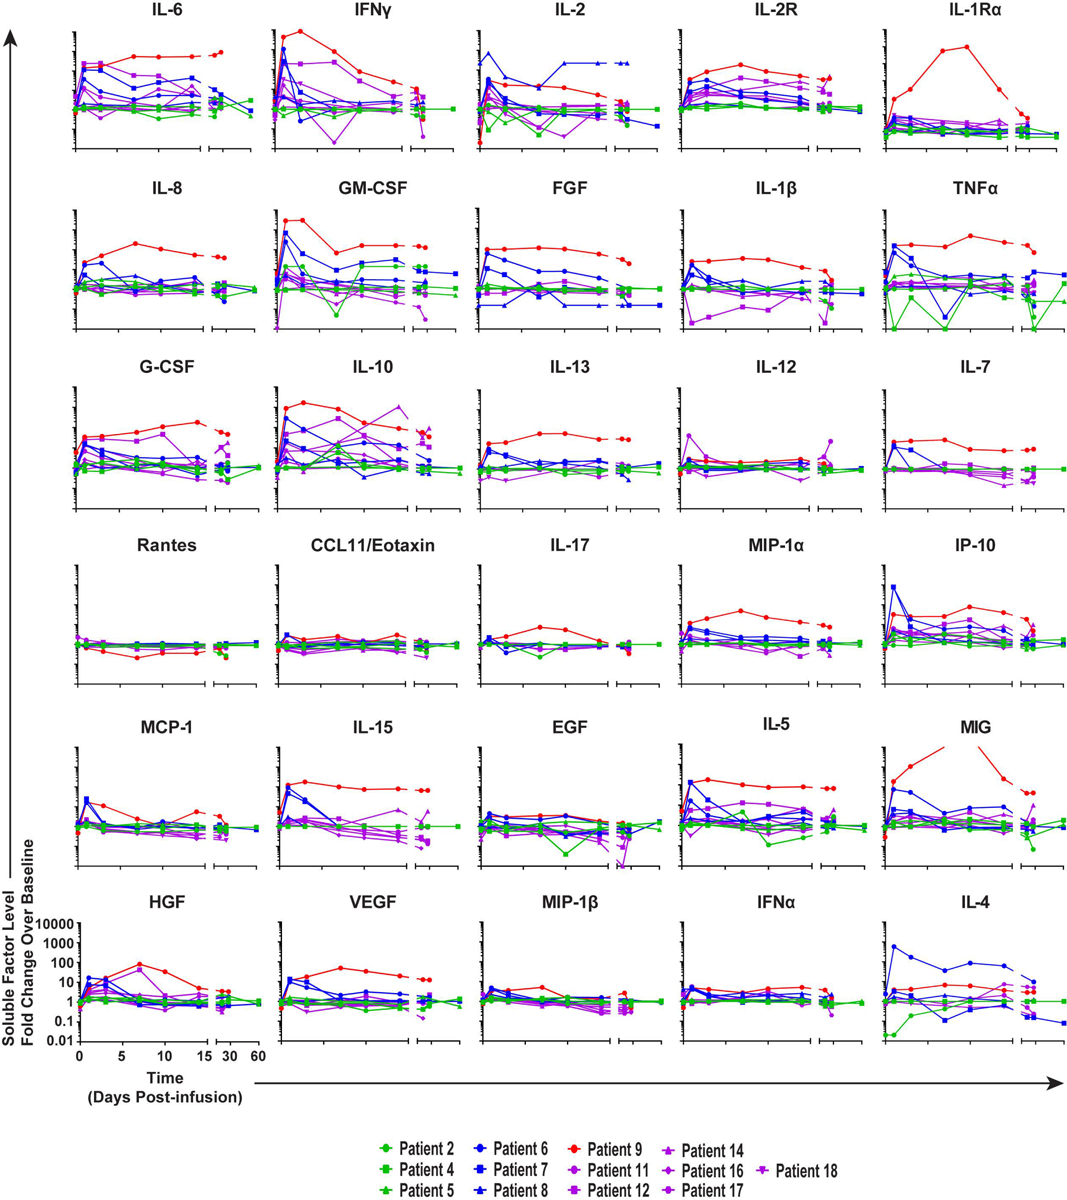
Fold changes in serum cytokine, chemokine and growth factor levels from baseline (preCAR T cell infusion) to each time point postCART-PSMA-TGFβRDN cell administration were measured in patients by multiplex analysis and are depicted as line graphs.