
Figure 1. Continuous stimulation at higher frequencies resulted in faster adaptation.
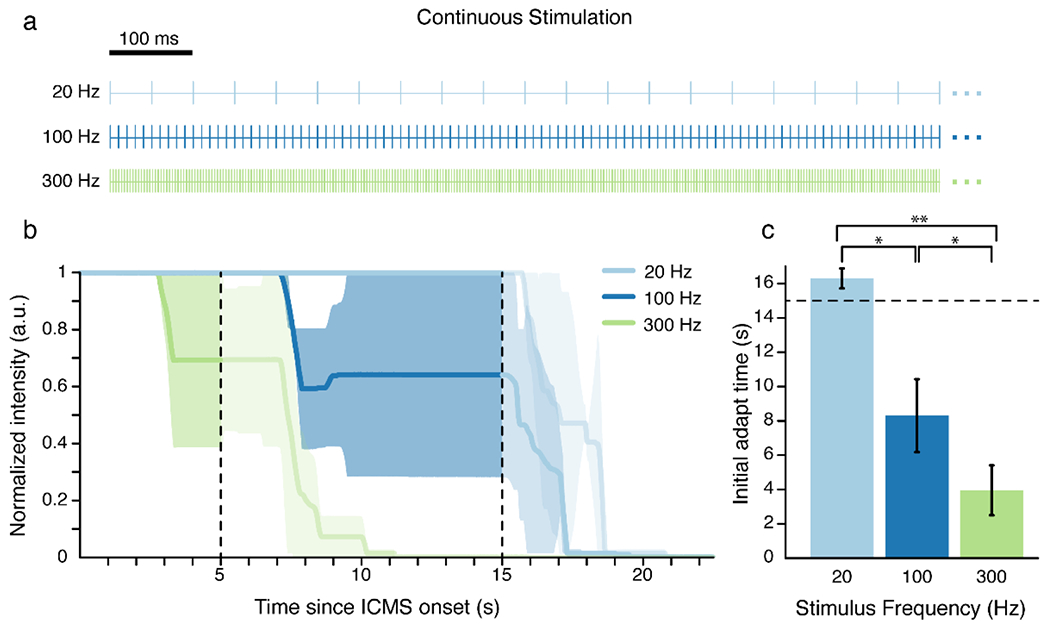
A) Continuous frequency trains. Each line represents an individual pulse. B) The participant reported the perceived intensity of the ICMS-evoked sensations using an analog slider. The slider always started at a value of 1 and the participant moved the slider to indicate changes in perceived intensity. Each colored line represents the median intensity for 5 electrodes at a given frequency. The shaded regions represent the median absolute deviation. The vertical dotted lines indicate the end of stimulation for the 300 Hz train at 5 s and the end of stimulation for the 20 and 100 Hz trains at 15 s. Slider values after stimulation stopped are shown in a lighter shade to emphasize the effects during stimulation. C) Time at which the perceived intensity began to decrease for the mean response at each stimulus frequency. Error bars show the standard error and the dotted line indicates the maximum stimulation time of 15 s. * indicates p < 0.05 and ** indicates p < 0.001.