
Figure 3. Intermittent stimulation caused less adaptation, which partially recovered over time.
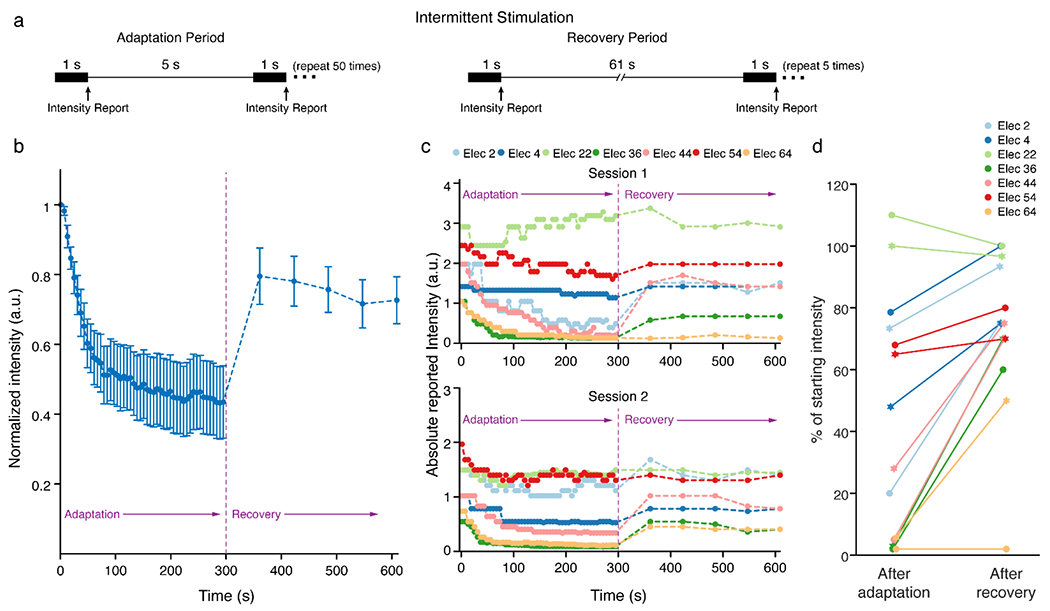
A) Intermittent adaptation and recovery paradigms. The participant reported the perceived intensity on a self-selected scale immediately after each 1-s stimulus train. Each stimulus train was perceived as a distinct event. B) Mean normalized intensity reports over time. The perceived intensity values for each electrode were normalized to the value reported after the first train so that the data could be combined across all electrodes. Blue dots represent the median intensity value measured at each time point across all electrodes. Error bars show the standard error. (C) The raw (not normalized) intensity values reported for each electrode in two sessions during the adaptation and recovery periods. The participant used a self-selected scale so the reported values were not constrained to fall within a particular range. Data were not normalized so that differences in the initial intensity of different electrodes are highlighted. (D) The percent change in intensity for each electrode after the adaptation and recovery periods. The change in intensity is calculated from each electrode’s initial intensity. Circular markers indicate the first session while star markers indicate the second session.