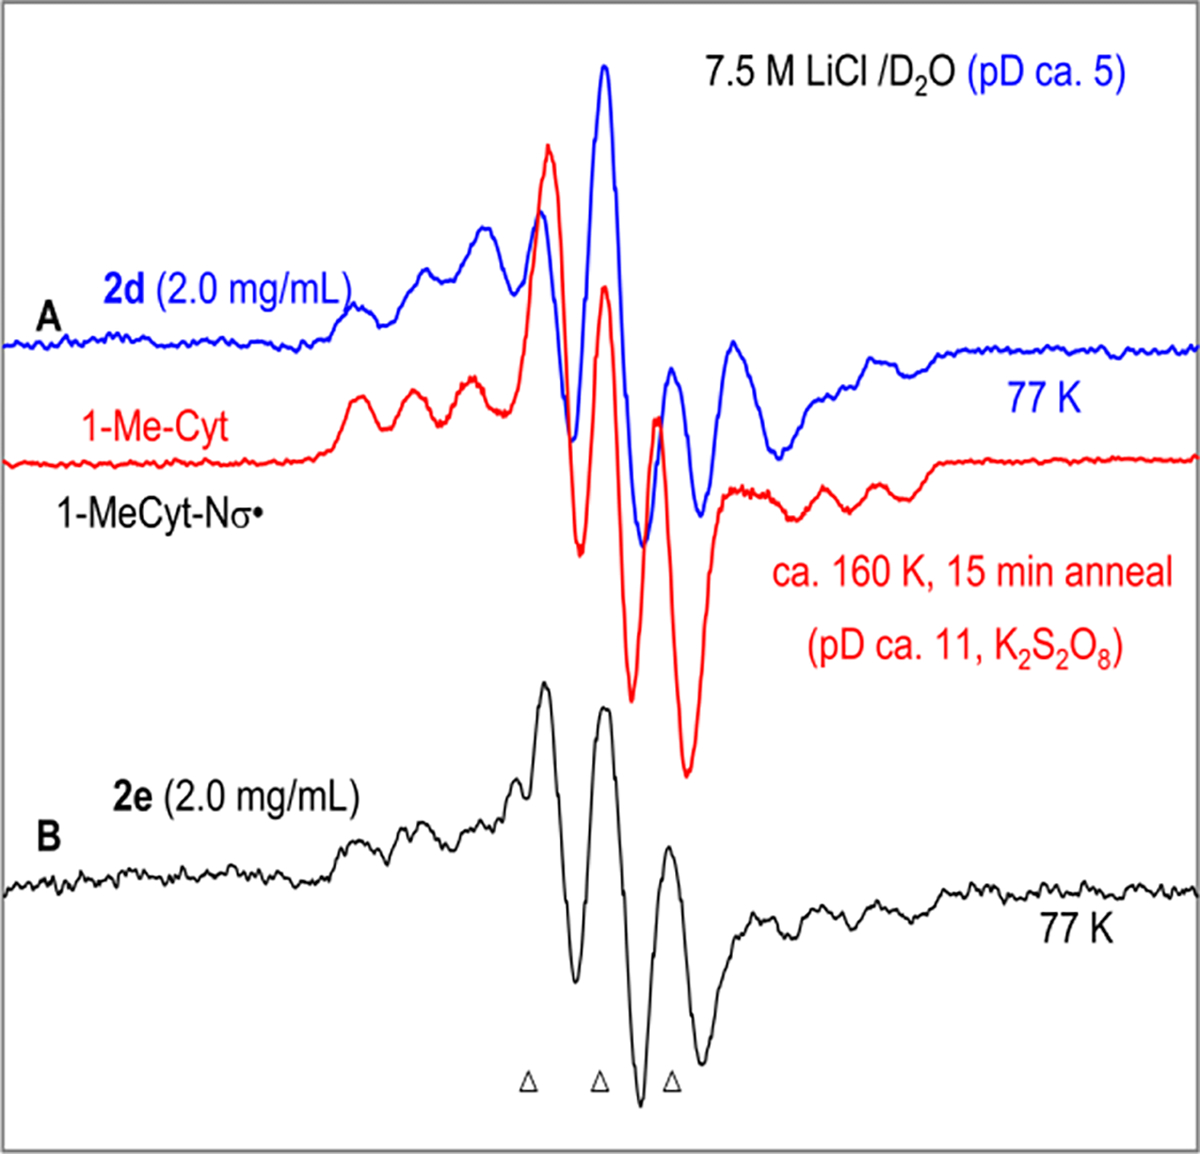
Figure 3.

First derivative ESR spectra after one-electron addition (single electron transfer) to (A) 2d (2.0 mg/mL, blue) and to (B) 2e (2.0 mg/mL, black) at 77 K in homogeneous glassy (7.5 M LiCl/D2O, pD ca. 5) solution. Electrons were generated by γ-irradiation (absorbed dose = 600 Gy at 77 K) of the glassy solution. The ESR spectrum (red) (reproduced from ref 53, Copyright [2015] American Chemical Society) shown in panel (A) is that of (Scheme 3) formed by one-electron oxidation of 1-MeCyt by (see ref 53 for details). The three reference markers (indicated by triangles at the bottom of the figure) in this figure are Fremy’s salt resonances. The central marker is at g = 2.0056, and the markers are separated from one another by 13.09 G.18,27,47,53
