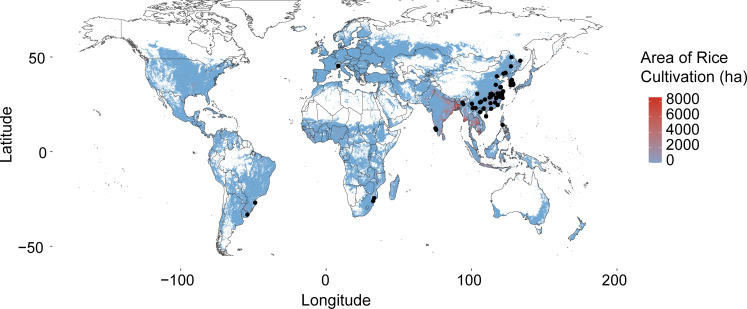
Fig 1.
The location of sampling sites in this study. The black dots represented the sampling sites. The color of different areas on the map represented the area of rice cultivation. The closer the color to red meant the larger the area of rice cultivation. Data on area of rice cultivation came from https://www.mapspam.info/data/.

