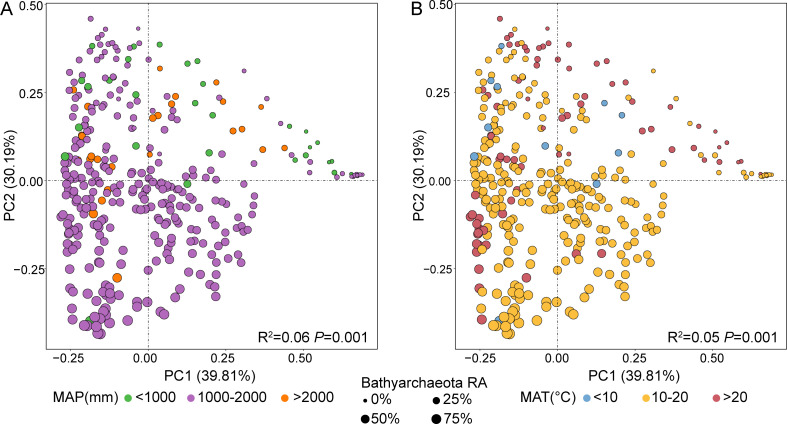
Fig 3.
PCoA based on Bray–Curtis distances and PERMANOVA of archaeal community. Figure (A) and (B) colored the points according to the MAP and MAT, respectively. Samples were classified into different groups according to theMAP and the MAT. For MAP, samples were divided into three groups (>2000 mm, >1000 mm and <2000 mm, <1000 mm). For MAT, samples were divided into three groups (>20℃, >10℃ and < 20℃, <10℃).

