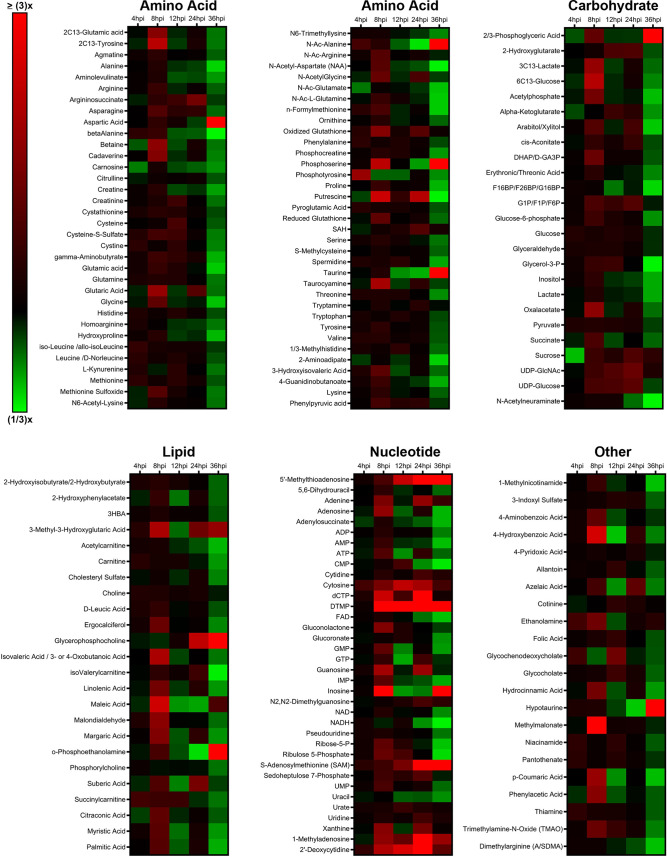
FIG 1.
Targeted aqueous metabolomics of mock versus MHV-68-infected cells. Mock-infected (control) and MHV-68-infected (MOI = 3) NIH 3T3 cells were harvested at 4, 8, 12, 24, and 36 hpi in three independent experiments. The relative fold change over the time course is depicted, where red shows an increase and green shows a decrease in metabolite concentration in MHV-68-infected cells compared to mock-infected cells. Metabolites are organized according to the major metabolic categories (carbohydrate, lipid, nucleotide, and amino acid) or as “other.”

