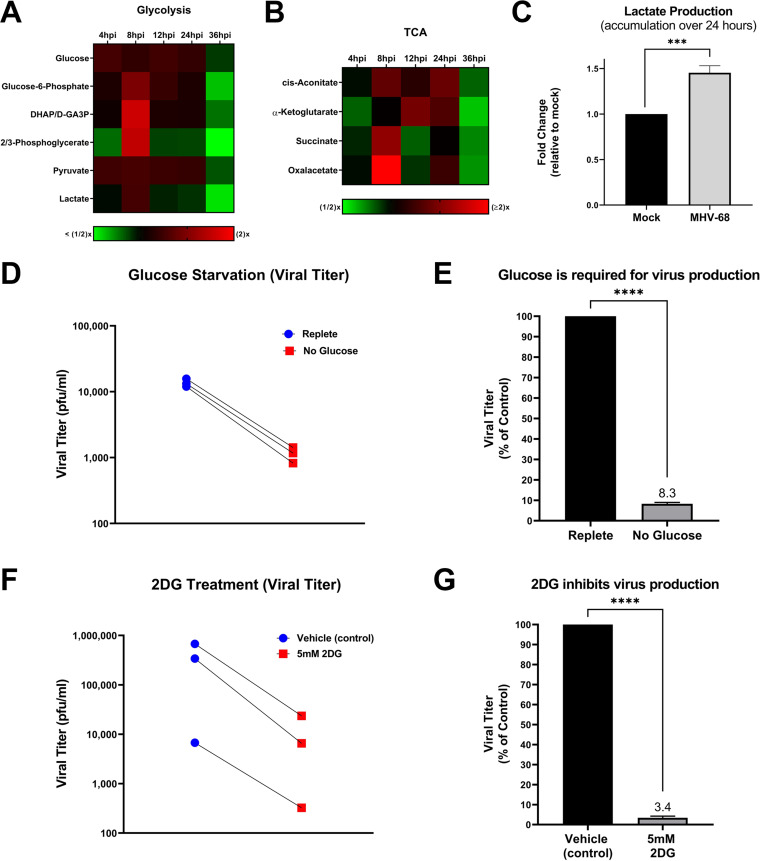
FIG 3.
MHV-68 increases glucose metabolism and requires glucose for infectious virion production. (A and B) Mock (control) and MHV-68-infected (MOI = 3) NIH 3T3 cells were harvested at 4, 8, 12, 24, and 36 hpi in three independent experiments. The relative fold change over the time course for glycolytic and TCA cycle intermediates is shown, where red depicts an increase and green shows a decrease in MHV-68-infected cells compared to mock-infected cells. (C) Accumulated lactate production (over 24 h) is increased in MHV-68-infected (MOI = 3) NIH 3T3 cells compared to mock-infected (control) cells. Cellular supernatant was collected at 24 hpi and accumulated lactate production was quantified using the Promega Lactate-Glo assay kit in three independent experiments. Data were normalized to cell number. (D and E) NIH 3T3 cells were MHV-68 infected (MOI = 0.1) in three independent experiments. Cells were fed replete medium (containing glucose and glutamine) for 24 h, which was replaced with fresh replete (control) or glucose-free medium for an additional 24 h. Viral titer was quantified from cell supernatants via plaque assays and graphed as PFU per milliliter or as a percentage of the control (replete medium). (F and G) NIH 3T3 cells were MHV-68 infected (MOI = 0.1) and treated with 5 mM 2DG or vehicle (control) for 48 hpi in three independent experiments. Viral titer was quantified from cell supernatants via plaque assays and graphed as PFU per milliliter or as a percentage of the control (vehicle treatment). ***, P < 0.001; ****, P < 0.0001.

